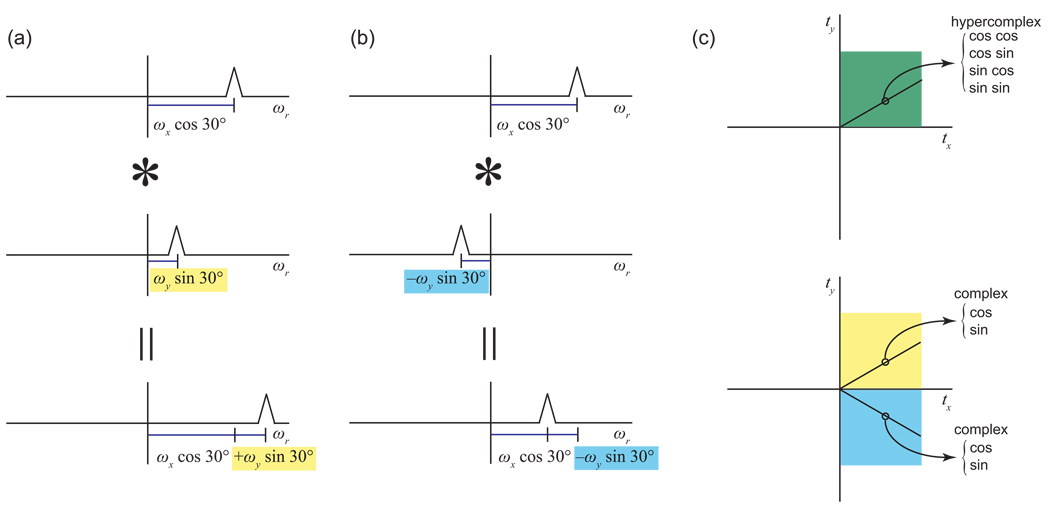
Figure 10. Convolution Interpretation of Radial Spoke Peak Positions, and Conversion of Hypercomplex to Complex Data.
(a) The frequency domain result of measuring a radial spoke can be understood geometrically as taking a projection; it can also be understood, however, as a convolution (denoted by *). In this example, a spoke is measured at an angle of 30° in a 2-D time domain. From the perspective of the spoke, the x signal would appear scaled by a factor of cos 30°. The y signal would likewise appear scaled by a factor of sin 30°. The actual time domain observation is the product of these two scaled signals, meaning that the resulting frequency domain signal is their convolution, a single peak at the position ωx cos 30° + ωy sin 30°. (b) If one measured a slice at an angle of −30°, the direction of the y modulation in the time domain would appear reversed. In the frequency domain, the y signal would appear at the position −ωy sin 30° instead of ωy sin 30°, and the result after convolution would be ωx cos 30° − ωy sin 30°. Measuring a slice at a negative angle would mean recording data at negative evolution times, which is not physically meaningful. However, equivalent data can be obtained by taking linear combinations of hypercomplex components. (c) NMR data collection is normally hypercomplex, and can only be carried out for positive evolution times. Once collected, however, that hypercomplex data can be converted to complex data, to produce slices at both positive and negative angles. The conversion process preserves all of the information in the data; in this example, four independent hypercomplex measurements become two complex data values in the +tx +ty quadrant, and two complex data values in the +tx −ty quadrant.

