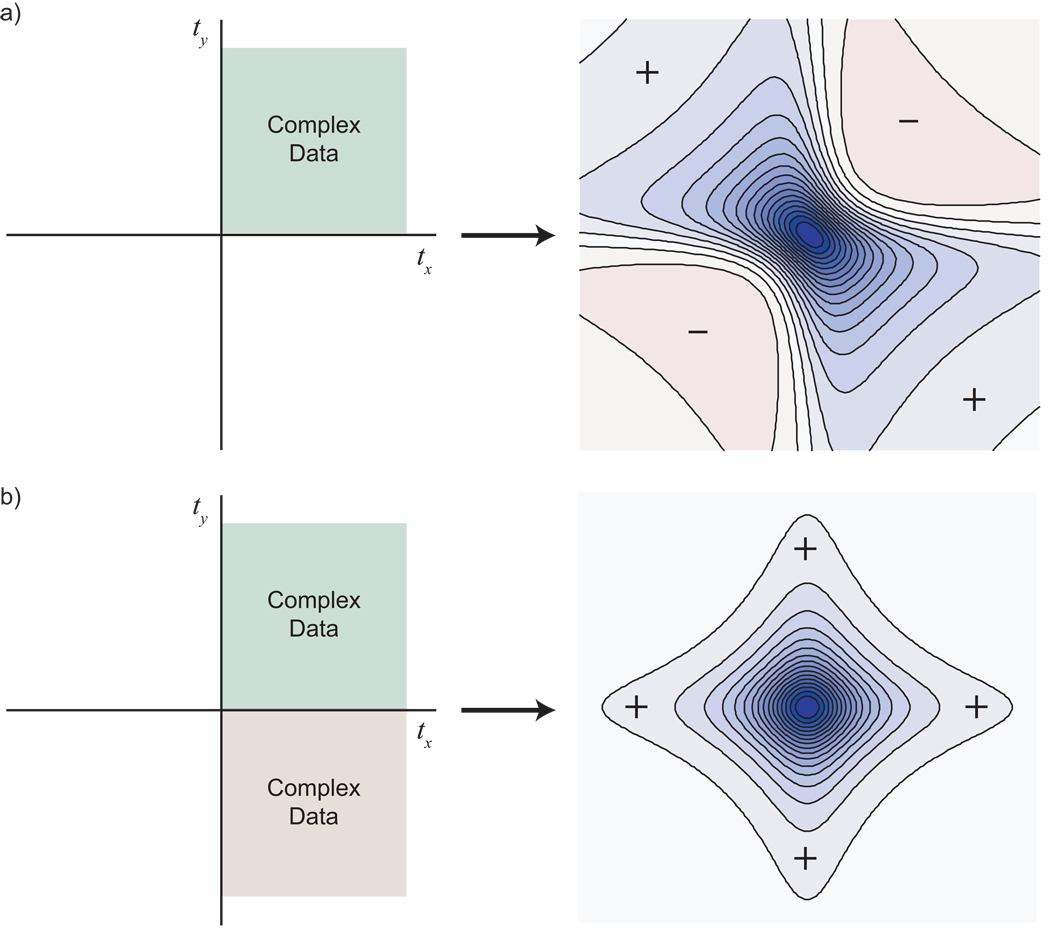
Figure 17. Data Reflection and Lineshapes.
(a) When complex data are available for only one quadrant, the result is a mixed-phase lineshape, as shown here in a contour plot (positive values are blue contours; negative values are pale red contours). (b) By reflecting the time domain data into a second quadrant, the dispersive terms are made to cancel, producing a purely absorptive lineshape.

