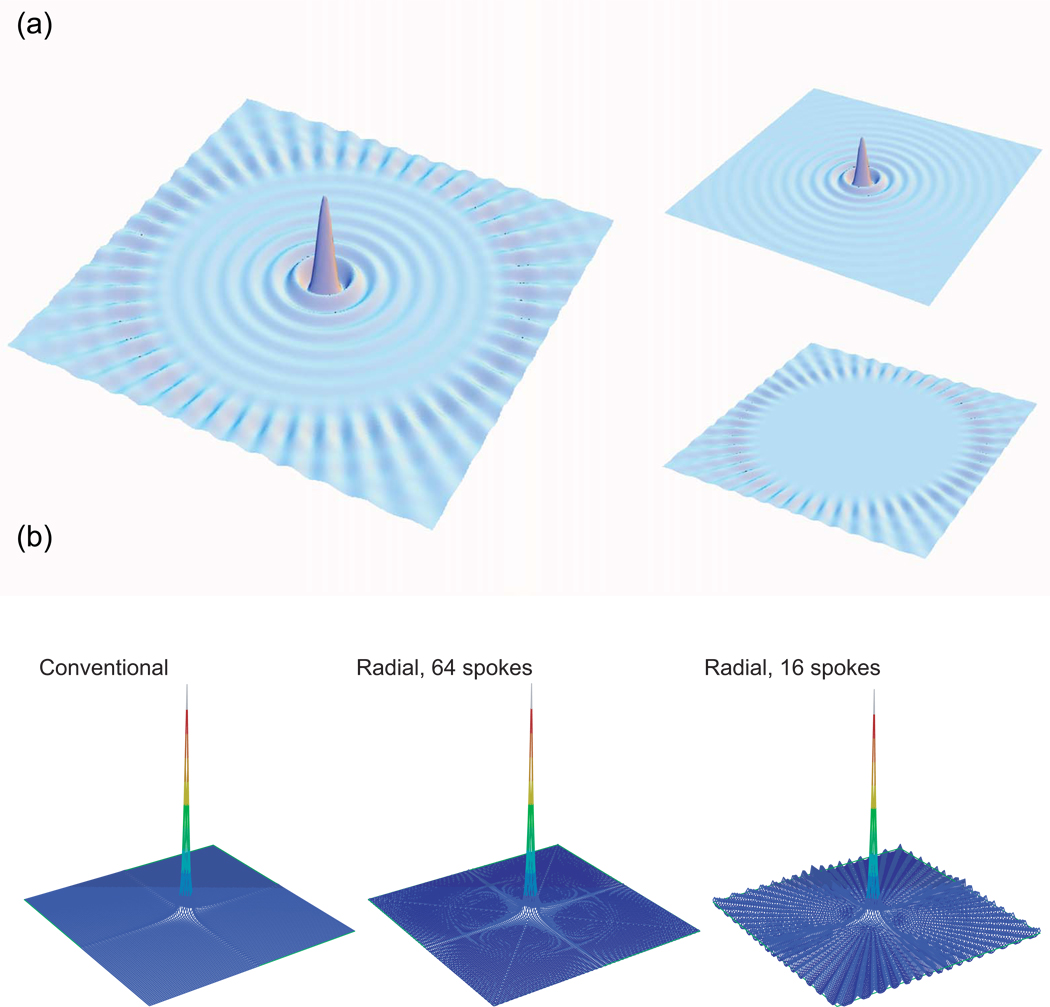
Figure 18. The Radial Sampling Point Response, and Polar Fourier Transform Results.
(a) The point response for radial sampling, plotted here for 25 radial spokes, can be separated into a ripple pattern and a ridge pattern. The ripples are the result of truncation from the finite duration of the sampling, and can be smoothed out by apodization. The ridges, which do not begin right at the peak but rather some distance from it, are the result of the radial configuration of the sampling points and are essentially a form of aliasing. The size of the “clear zone” that is free of ridge artifacts has been found to depend on the maximum evolution time in the time domain and the number of radial spokes. (b) Polar Fourier transforms from simulated radial data with 16 and 64 spokes is compared to the Fourier transform of simulated conventional data. With 16 spokes, the clear zone extends only just beyond the peak, and the ridges are seen over most of the spectrum. With 64 spokes, the clear zone extends beyond the edge of the spectrum, and thus no artifacts are seen. Reprinted from [37].

