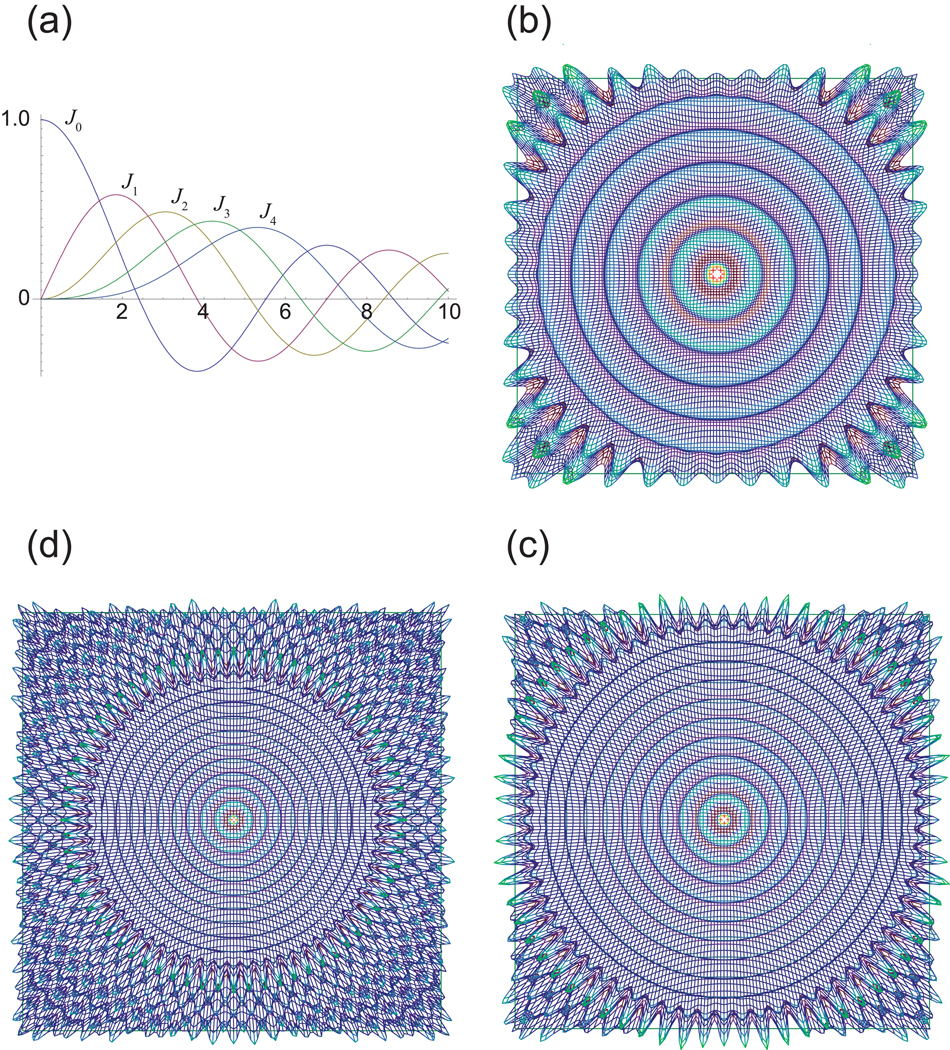
Figure 19. Bessel Functions and the Radial Sampling Point Response.
The radial sampling point response can be derived analytically as the sum of a set of terms generated by the individual rings of sampling points. (a) A plot of the Bessel functions of orders zero to four, traditionally designated J0 to J4. (b) The Fourier transform of a single ring of sampling points is a Bessel function with respect to radius, and a sinusoid with respect to angle. This case corresponds to 10 radial spokes. (c) The case of a ring of sampling points corresponding to 16 radial spokes. Increasing the number of sampling points increases the frequency of the sinusoidal oscillation with respect to angle, and increases the order of Bessel function with respect to radius. (d) The case of a ring of sampling points corresponding to 16 radial spokes, but with a larger radius in the time domain. The result in the frequency domain is the same as (c), except scaled to have a smaller radius in the frequency domain, and therefore a smaller clear zone. Since each concentric ring of sampling points in a radial pattern has the same number of points, the terms they generate are of the same order but with different scaling, as in (c) and (d). The sum of terms like (c) and (d) for many radii generates the point response shown in Fig. 17.

