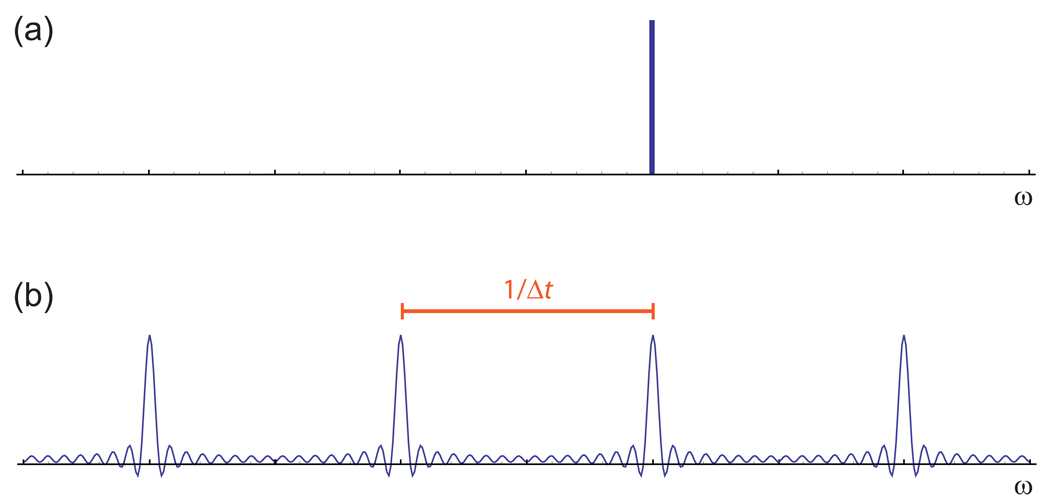
Figure 2. Comparison of Spectra for Continuous and Sampled Signals.
(a) The spectrum of a continuous signal contains a single, infinitely sharp peak at the signal frequency. (b) The spectrum of the same signal sampled at regular intervals over a finite period of time shows both aliasing and truncation artifacts, reflecting the ambiguities of the sampling.

