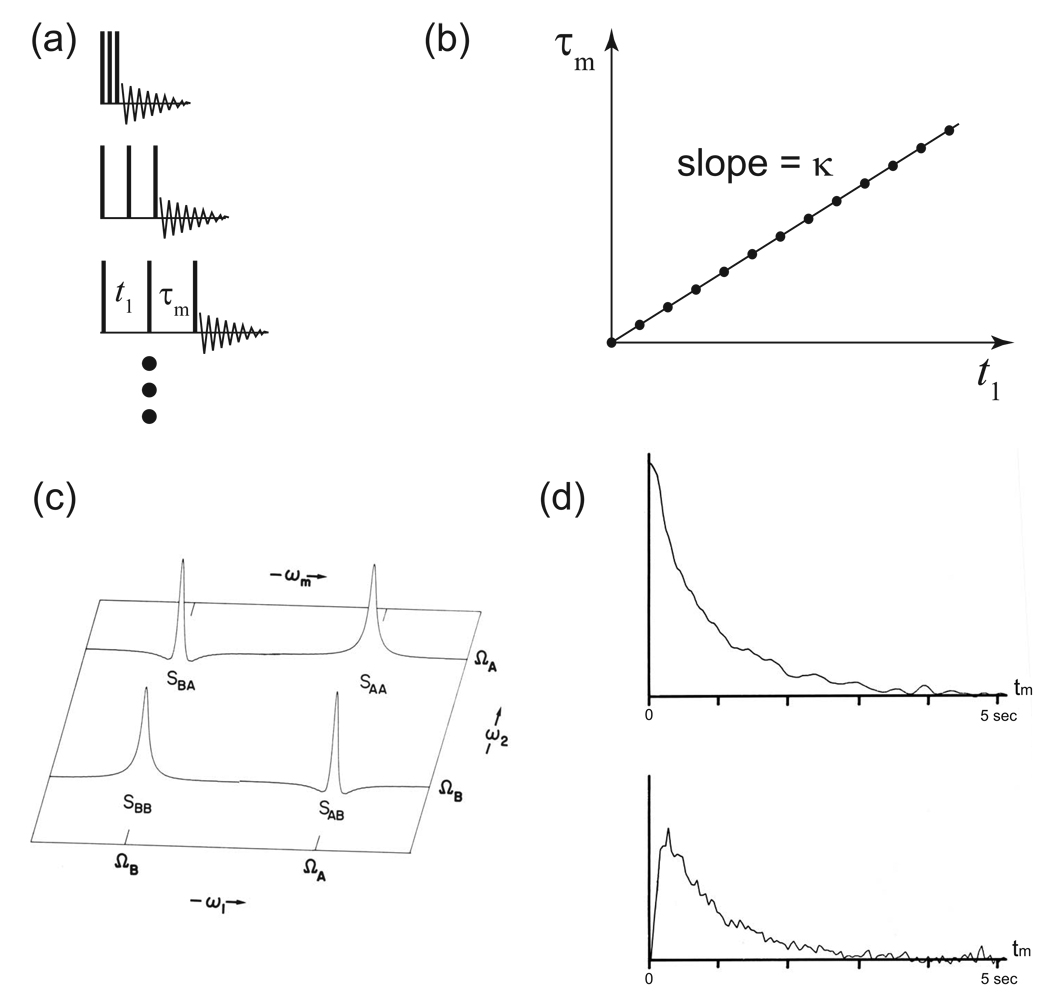
Figure 20. Accordion Spectroscopy.
(a) In an accordion experiment, the evolution time, t1, and the mixing time, τm, are increased simultaneously. The expanding pulse sequence can be likened to the bellows of an accordion. (b) The sampling points in an accordion experiment trace out a radial spoke, but unlike most radial experiments, one of the two dimensions is a mixing time rather than a chemical shift. The proportionality constant relating the simultaneous increases in the two experimental parameters is κ, which determines the slope (and therefore the angle) of the radial spoke. (c) A schematic representation of the data that would result from the accordion experiment. The lineshapes of the diagonal and cross-peaks reflect the dynamics of the exchange process observed during the experiment. (d) The peaks in an accordion spectrum can be inverse-Fourier-transformed to reveal the buildup curves. Shown here are the transforms of one diagonal peak (top) and one crosspeak (bottom) from cis-decalin, measured at 240 K in a Bruker 300 MHz spectrometer. Panels (c) and (d) are reprinted from [82].

