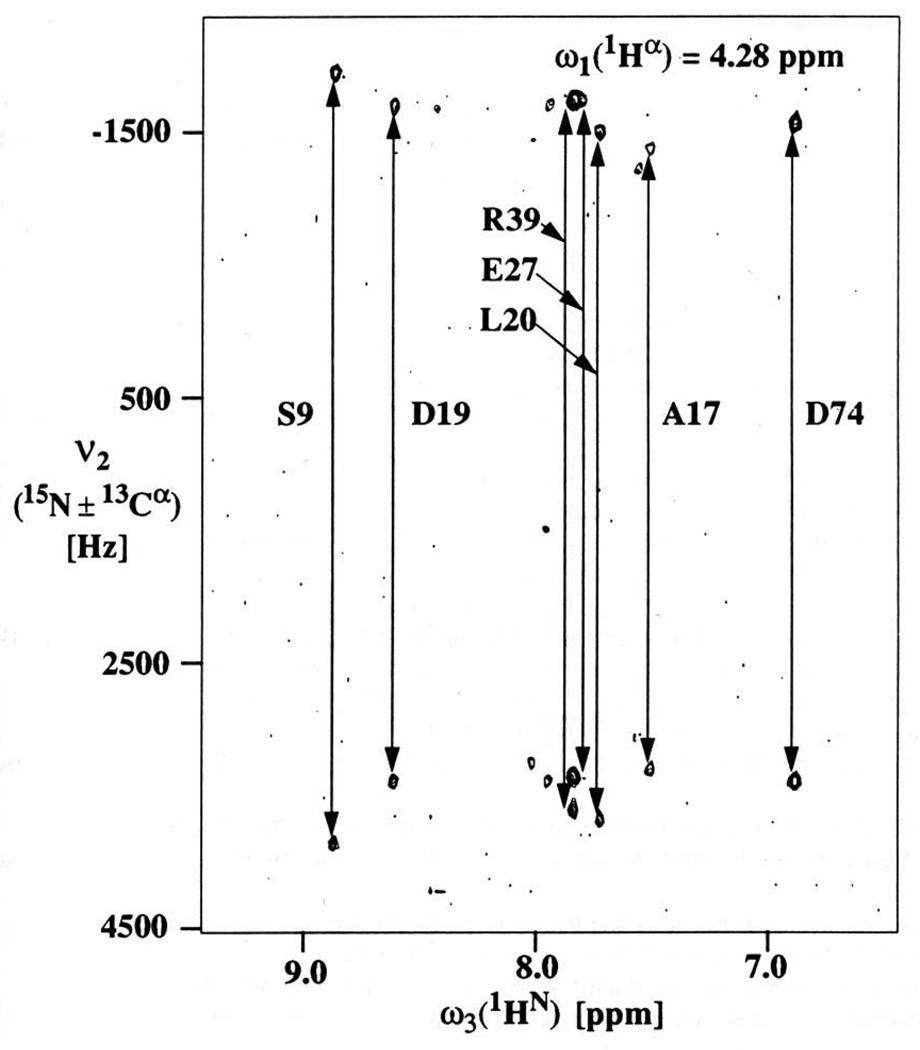
Figure 21. Reduced Dimensionality NMR.
Contour plot of a plane from the first reduced dimensionality experiment, the multiple quantum (3,2)-D HACANH of the mixed disulfide of E coli glutaredoxin (C14S) and glutathione, recorded on a 600 MHz spectrometer. The plane is taken at an Hα chemical shift of 4.28 ppm. Reprinted, with permission, from [47] (© 1993 ESCOM Science Publishers B.V.).

