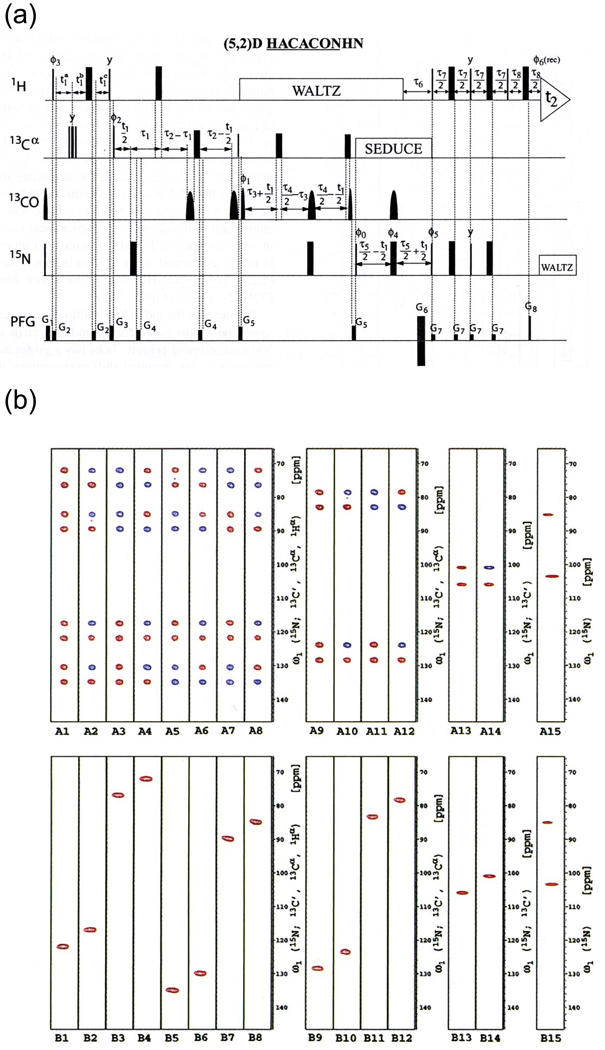
Figure 24. (5,2)-D GFT. The first GFT experiment was the (5,2)-D HACACONH of ubiquitin.
(a) The pulse sequence. (b) Data for residue S20, showing the full hierarchical splitting pattern and the separation of multiplet components onto subspectra. At left are the strips for the 8 basic spectra, followed by the four first-order central peak spectra, the two second-order central peak spectra, and finally the one third-order central peak spectrum. In each case, the top half of the panel shows the transforms of the hypercomplex components prior to application of the G matrix, showing the full multiplet patterns, while the bottom half shows the result after application of the G matrix, with multiplet components separated onto independent subspectra. Reprinted, with permission, from [52] (© 2003 American Chemical Society).

