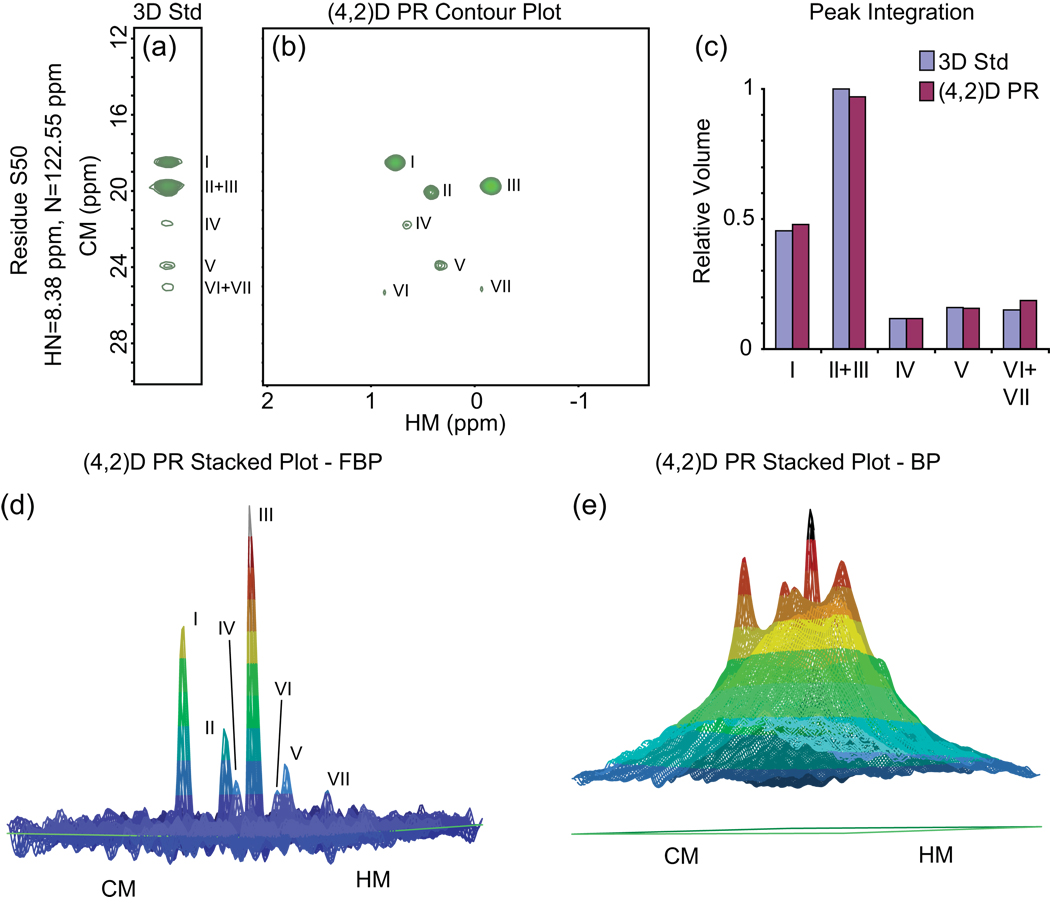
Figure 29. Projection-Reconstruction Methyl/Amide NOESY of HCA II.
Data are shown for residue S50. (a) Strip from the 3-D conventional experiment at the (HN,N) coordinates of residue S50. (b) Contour plot of the equivalent HM/CM plane from the (4,2)-D reconstruction, computed from 100 projections using FBP. (c) Comparison of peak volumes between the conventional 3-D experiment and the (4,2)-D reconstruction. (d) Stacked plot. (e) Stacked plot from a BP reconstruction. The comparison with (d) shows the advantages of using the filter function. Panels (a)–(d) reprinted, with permission, from [71] (© 2005 American Chemical Society).

