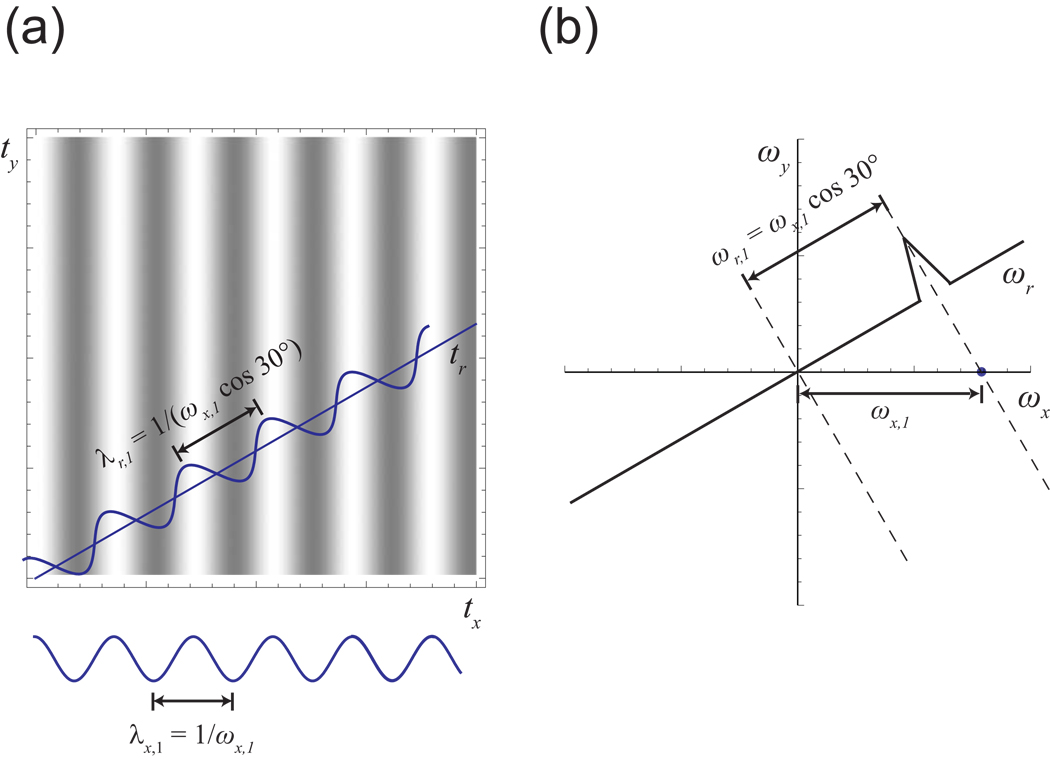
Figure 9. Scaled Wavelengths in the Time Domain Determine Projected Peak Positions in the Frequency Domain.
(a) Consider a signal with modulation only in the x dimension, at a frequency of ωx,1. In the time domain, this signal would appear as a plane wave with a wavelength λx,1 of 1/ωx,1. The wavelength λr,1 that would be observed by a slice at a 30° angle would be 1/(ωx,1 cos 30°). The wave therefore appears to be scaled by a factor of 1/(cos 30°) when measured by the slice. (b) In the 2-D frequency domain, the peak from the signal would be located along the ωx axis at position ωx,1. The Fourier transform of the 30° slice would show a projection of this peak, appearing at ωx,1 cos 30°.

