
Figure 3. Lower ATP citrate lyase protein in pancreatic islets of GK rats compared to islets of Wistar rats.
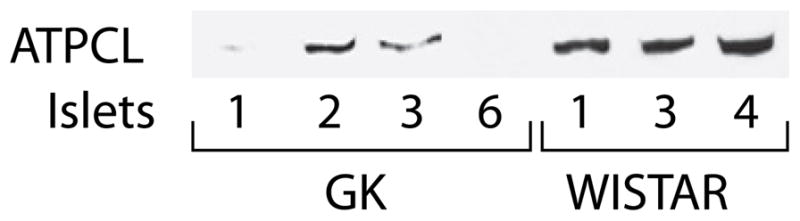
Immunoblot with 15, 13.5, 15, 16, 9.5, 11.5 and 9 μg protein per lane in lanes with islet samples GK-1, 2, 3 and 6 and Wistar-1, 3 and 4, respectively.