Figure 4.
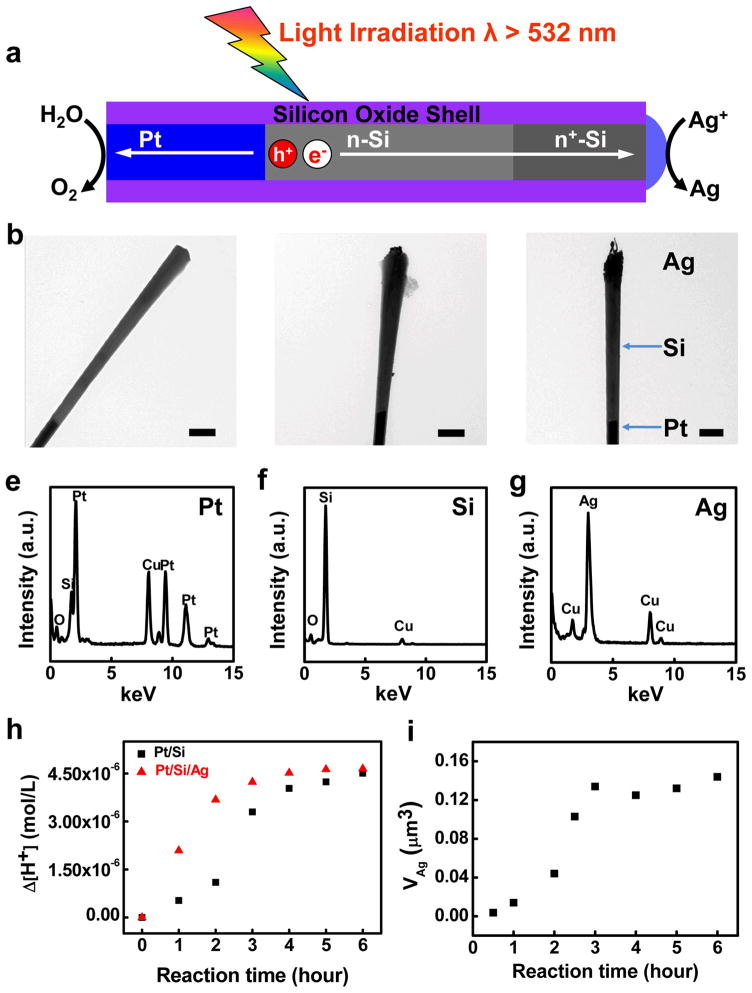
Formation of Pt/Si/Ag nanowire photodiodes. (a) Schematic illustration of self-catalyzed silver photoreduction. Only long wavelength light (λ>532 nm) were used here to avoid significant homogeneous photodecomposition of AgNO3. (b) Pt/Si nanowire before silver photoreduction. (c) Pt/Si nanowires dispersed in 1mM AgNO3 solution with 0.5 hour light irradiation. (d) Pt/Si/Ag nanowire diode obtained after 3 hours light irradiation in 1mM AgNO3 solution. The scale bars in b–d is 700 nm. (e–g) EDX spectra of three distinct sections (Pt, Si and Ag) of a nanowire photodiode. (h) Plot of the net change of proton concentration with the reaction time. Black square (red triangle) represent the result obtained from 2.2 × 10⁷ Pt/Si (Pt/Si/Ag) photodiodes in 6 ml of 1 mM AgNO3 solution. (i) Plot of the largest total silver volume with the reaction time.

