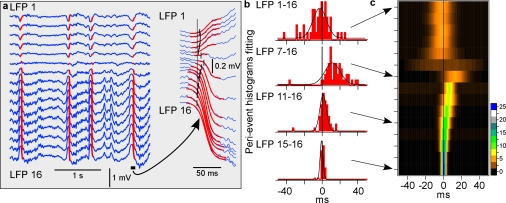
Figure 1.
Depth profile of the LFP during natural slow-wave sleep. (a) LFPs recorded with a 16-channel Michigan probe, inserted perpendicularly to the cortical surface. Red lines show sigmoidal fits of the transitions from silent state to active states. The point at which a fit reached 10% of its amplitude was taken as the onset time of an active state. One cycle is shown at expanded scale. (b) Histograms of delays of the active state onsets in indicated channels relative to the activity onset in channel 16, taken as the reference. Fifty cycles were used. Black lines show Gaussian fits. (c) Depth profile of active state onsets. For each channel, Gaussian fit of the distribution of activity-onset delays relative to channel 16 is shown, color coded for n cycles as indicated by the scale bar.

