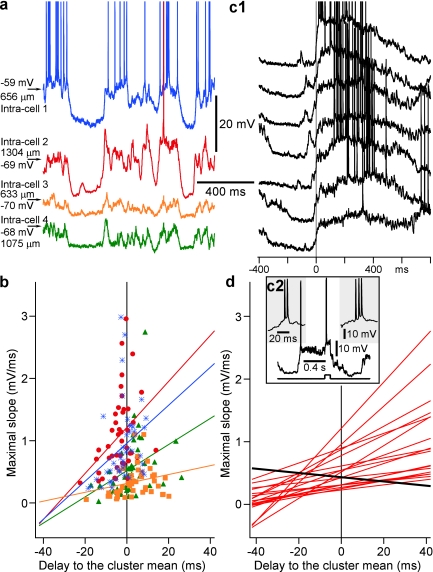
Figure 10.
Earlier involvement in activity is associated with slower transitions to active states. (a) A segment of simultaneous quadruple intracellular recording from closely located neurons in area 7, performed under ketamine/xylazine anesthesia. (b) Maximal slope of a transition from silent to active state, estimated from sigmoid fitting, plotted against the delay of the cell relative to the mean onset of activity in the cluster. Each point shows data for one cycle. For each cell, a regression line is shown. Color code corresponds to the 4 cells in (a). Note that in cycles in which activity onset in a cell was earlier than in other cells (negative delays), the slope of transition was smaller, typical for a progressive synaptic buildup. (c1) Examples of transitions from silent to active state in a cell that often showed a strong buildup of depolarization prior to the transition. Zero time is half amplitude of depolarization. The cell was IB, as identified by bursts during both spontaneous activity (left inset in c2) and in responses to depolarizing current pulses (right inset in c2). (d) Relation between maximal slope of transition from silent to active states and the delay of activity onset in the cell relative to the mean onset in the cluster. Regression lines (as in b) for 18 cells. Note that in 17 of 18 neurons, earlier onsets of active state were associated with smaller slopes of transition. The only one cell showing an inverse relation (black line) is illustrated in c.

