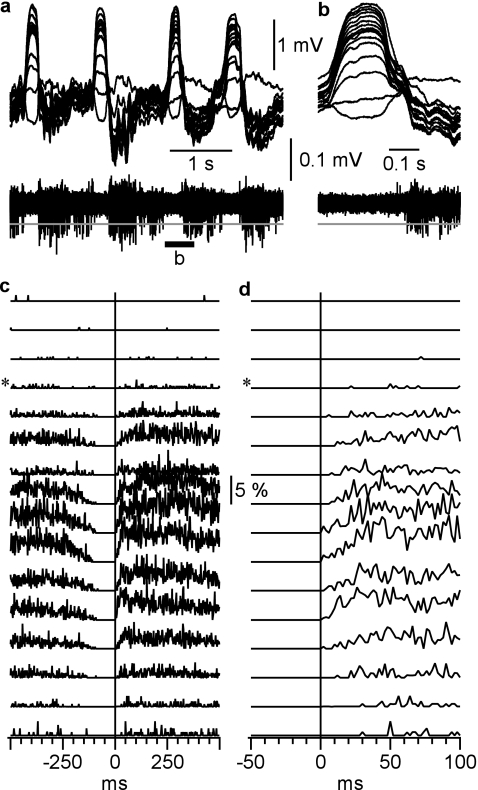
Figure 3.
Depth distribution of neuronal firing during slow-wave sleep. (a) LFP (top traces) and multiunit activity (bottom trace) recordings at the border of cortical areas 5 and 7 (associative cortex) during short episode of slow-wave sleep. Recordings were performed with a 16-channel silicon probe inserted perpendicularly to the cortical surface. The recording sites were separated by 100 μm, the upper recording site was just below cortical surface. LFP and multiunit activity traces were obtained from the same electrodes, by band-pass filtering 0.1 Hz to 10 kHz and 0.5–10 kHz, respectively. (b) A segment from (a) as indicated by the bar, at higher temporal resolution. (c) Probability distributions of multiunit firing during a cycle of slow oscillation. Pooled data from 290 cycles from 5 different sleep episodes. Spikes were detected as all peaks that exceeded a threshold (gray lines in a and b), set at 5× SD of the noise fluctuations during silent state. * Indicates the electrode at which the polarity of slow waves were reversed. Vertical line shows onset of active state determined in the LFP recorded from the deepest electrode. (d) Zoom in on the silent to active state transition from (c). Note that the first firing occurs in neurons located between 800 and 1200 μm from cortical surface.

