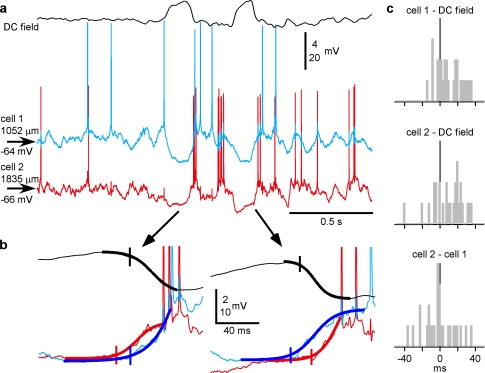
Figure 7.
The high variability of active state onsets in cells during natural sleep. (a) Simultaneously recorded DC field potential and intracellular activity of 2 closely located (<100 μm in lateral distance) neurons. (b) Two cycles from (a) shown at expanded scale. Action potentials are truncated. The thick line shows sigmoid fits of transitions to active states. Note the opposite order of activity onset in the 2 cells in 2 consecutive cycles. (c) Distributions of the activity-onset delays in the 2 cells relative to the onset of active state in DC field potential and in the simultaneously recorded cell. Note that all distributions cover zero, and thus, in any pair, the opposite orders of activation were encountered, with delays up to 40 ms.

