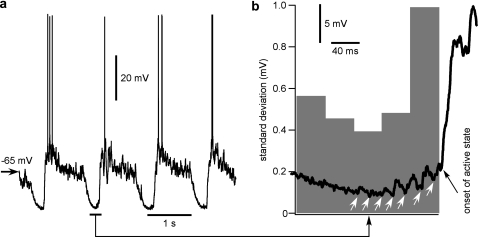
Figure 9.
Membrane potential fluctuations increase just before the onset of active state. (a) Intracellular recording in suprasylvian gyrus (area 7) of cat anesthetized with a mixture of ketamine and xylazine. (b) A segment from a is enlarged and superposed on a histogram showing the averaged membrane potential SD (n = 50 cycles, 0 time is active state onset defined with sigmoid fit). Bin width is 40 ms. Note the large increase in the SD of the membrane potential just prior to the active state onset.

