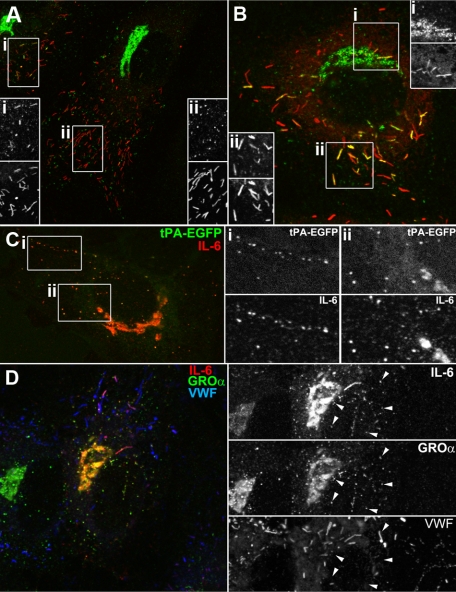
Figure 4.
IL-6 is present in the tPA-EGFP organelle and WPBs in IL-1β–treated cells. (A-B) Examples of single cells labeled for endogenous IL-6 (green in color-merged panels) and endogenous VWF immunoreactivity (red in color-merged panels). (C) Endogenous IL-6 immunoreactivity (red in color-merged image) in a cell expressing tPA-EGFP (EGFP fluorescence green in color-merged image). Regions indicated by the white boxes are shown in grayscale to the right of each image. (D) Endogenous IL-6 (red and top panel in grayscale images), GRO-α (green and middle panel in grayscale images), and VWF (blue and bottom panel in grayscale images) immunoreactivity in an IL-1β-pretreated cell.

