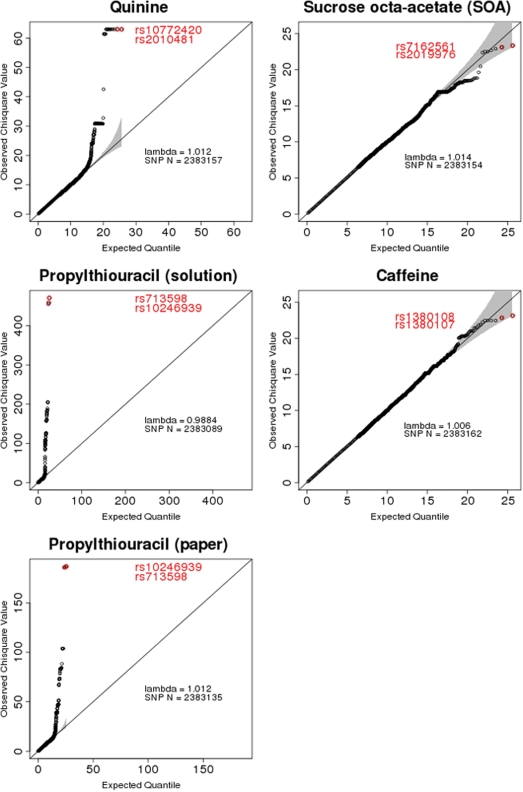
Figure 4.
The Q–Q plots for each of the five substances analyzed. The 95% confidence interval is shown in gray. Values lifting above the quinine plot were from a single location on chromosome 12 within and near the TAS2R19 gene; most of these for PROP (in solution and PROP papers) centered on chromosome 7 within and near the TAS2R38 gene. The excess of SNPs with small P-values is low, and all λ values are near 1.0.

