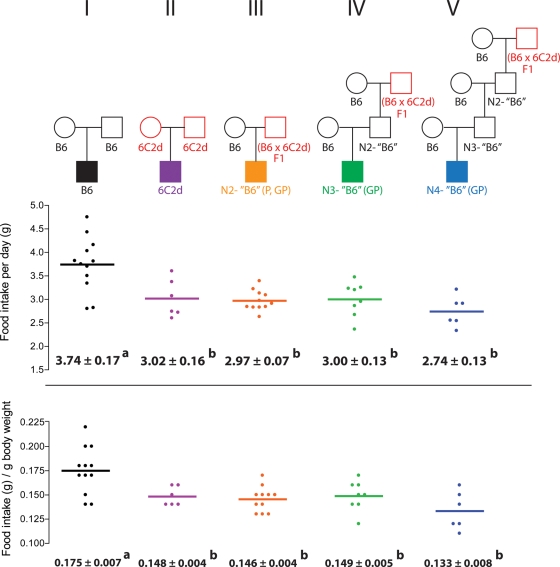
Figure 5.
A transgenerational genetic effect on food intake. Food intake per day and food intake per gram of body weight is shown for control B6, control 6C2d, N2-‘B6’, N3-‘B6’ and N4-‘B6’ male mice. Circles represent females, squares represent males. Mean values ± SEM are shown. Mean values with different superscript letters correspond to groups that are significantly different (P < 0.05 following Tukey's multiple testing correction), whereas mean values with identical superscript letters correspond to groups that are not significantly different (P > 0.05 following Tukey's multiple testing correction). Red indicates heterozygosity or homozygosity for the Obrq2aA/J allele.

