Figure 1.
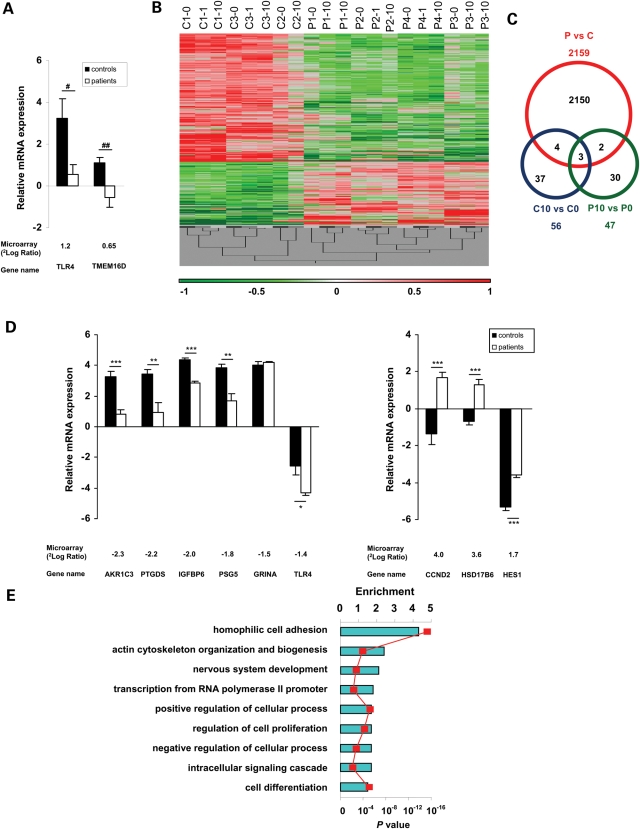
Gene expression profiling in fibroblasts from patients with mutations in MCT8 and controls. (A) Verification of microarray results by qPCR. Genes which responded differently to T3 treatment were confirmed by qPCR. Results are shown as mRNA levels expressed relative to that of the house-keeping gene Cyclophilin A (ΔCt ± SEM). The black bars represent controls and the white bars represent patients. Underneath the figure are the gene names and the values obtained by microarray analysis shown as 2log ratio of the fold change in gene expression between patients and controls. #P = 0.07; ##P = 0.08. (B) Gene expression profiles of fibroblasts cultured in different thyroid states (0, 1, 10 nm T3) from patients (P) and controls (C). OmniViz Treescape showing the hierarchical clustering of 1617 unique genes (2159 probe sets) which matched the selection query. Gene expression levels: red, up-regulated genes compared with the geometric mean; green, down-regulated genes compared with the geometric mean. The color intensity correlates with the degree of change. (C) Venn diagram of DE genes between patients (P) and controls (C) per se (red), the effects of 10 versus 0 nm T3 treatment on control fibroblasts (blue; C10 versus C0), the effects of 10 versus 0 nm T3 treatment on patient fibroblasts (green; P10 versus P0) and the overlaps. (D) Verification of microarray results by qPCR. Six down-regulated (left panel) and three up-regulated (right panel) were selected from the microarray results. Results are shown as mRNA levels expressed relative to that of the house-keeping gene Cyclophilin A (ΔCt ± SEM). The black bars represent controls and the white bars represent patients. Underneath the figure are the gene names and the values obtained by microarray analysis shown as 2log ratio of the fold change in gene expression between patients and controls. *P < 0.05; **P < 0.01; ***P < 0.001. (E) GO-enrichment analysis of DE genes in fibroblasts from MCT8 patients versus controls. Enriched GO terms for biological processes were selected from the DAVID functional annotation clustering module and corrected for multiple testing (P < 0.01; see Supplementary Material, Fig. S1 and Table S10 for extensive lists). Enrichment is shown on the upper axis. P-values are represented by the red squares.

