Figure 5.
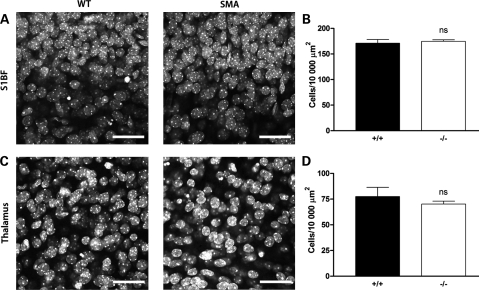
No change in cell density or cell proliferation markers in the primary somatosensory cortex or unaffected thalamic nuclei in severe SMA mice. (A) Representative confocal micrographs showing TOPRO3-labelled nuclei of all cells in the primary somatosensory cortex (S1BF) from wild-type (WT; left panel) and Smn−/−;SMN2 (right panel) mice at late-symptomatic (P5) ages. No qualitative differences in cell density were observed in Smn−/−;SMN2 mice. (B) Bar chart (mean ± SEM) showing cell density measured in the S1BF region (layers IV and V) of the brain in wild-type (+/+) and Smn−/−;SMN2 (−/−) mice at P5. There was no significant difference between the genotypes (ns P > 0.05; unpaired t-test. n = 4 mice per genotype). (C) Representative confocal micrographs showing TOPRO3-labelled nuclei of all cells in non-affected VPM/VPL thalamic nuclei from wild-type (left panel) and Smn−/−;SMN2 (right) mice at late-symptomatic (P5) ages. No qualitative differences in cell density were observed in Smn−/−;SMN2 mice. (D) Bar chart showing cell density measured in the thalamus in wild-type (+/+) and Smn−/−;SMN2 (−/−) mice at P5. There was no significant difference between the genotypes (ns P > 0.05; unpaired t-test; n = 4 mice per genotype). Scale bar = 35 µm.

