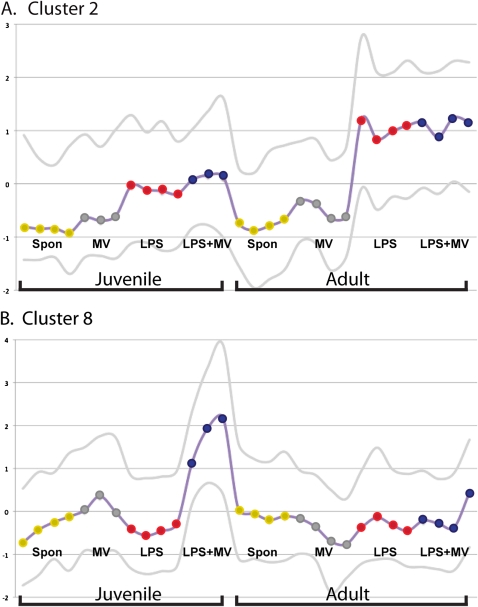
Figure 7.
K-median cluster analysis of the two-way ANOVA results in two different clusters. (A) Cluster 2, containing 387 genes that were increased in expression only in adult mice treated with LPS or LPS+MV. (B) Cluster 8, containing 248 genes that were increased in expression only in juvenile mice treated with LPS+MV. The horizontal axis represents individual mice (also shown as colored dots on the median line). The vertical axis is the median expression of the genes in the individual mice. The lower and upper lines show the 5th and 95th percentiles, respectively.

