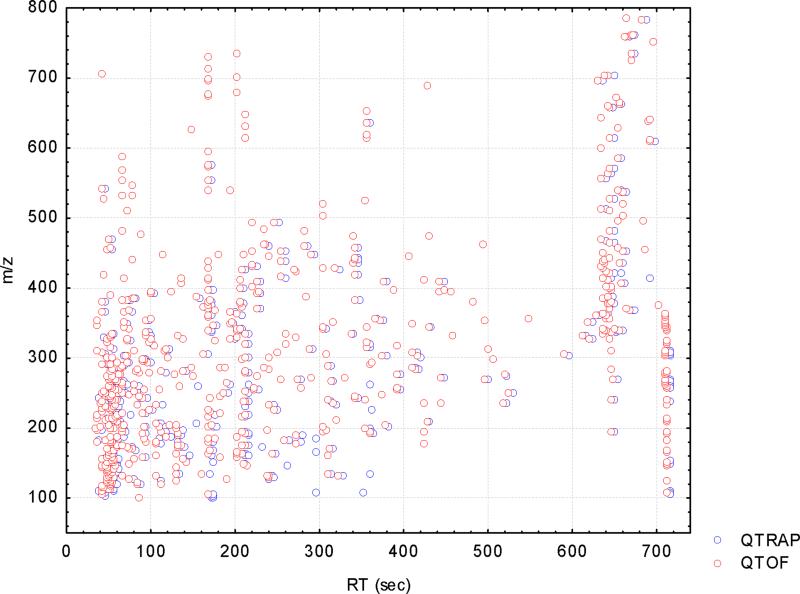
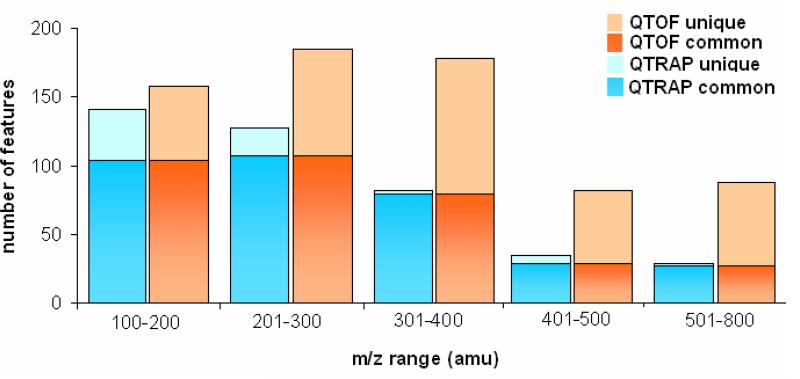
Figure 1.
a) Scatter plot of the features detected in positive ESI in the QTOF (red circles) and the QTRAP (blue circles) overlaid in retention time and mass range. b) Bar plots showing the common (lower part of the bar), unique (upper part of the bar)and total (sum of the two) ions from the two instruments sorted according to mass range.


