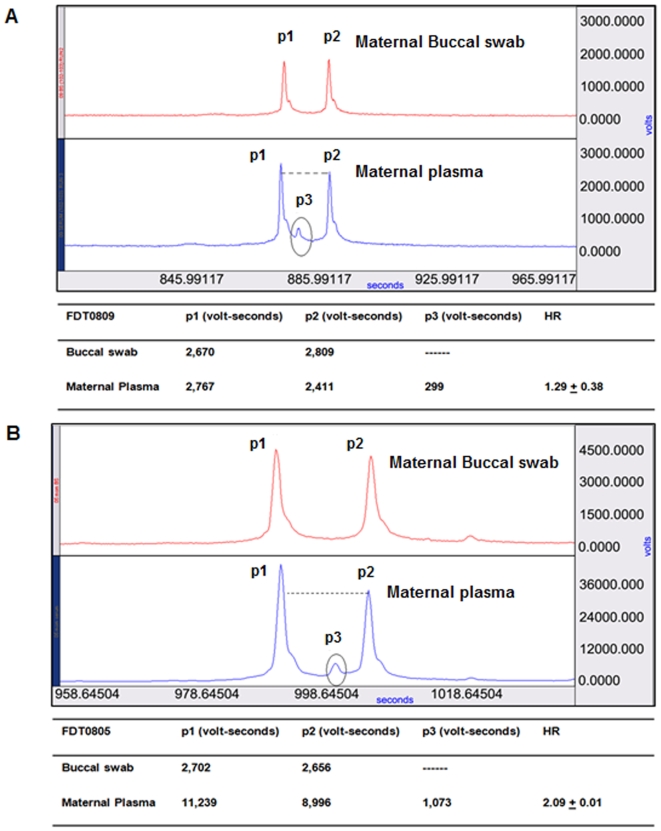
Figure 4. CTCE electropherogram and haplotype ratio calculations.
(A) and (B) each is a combination of two panels (top panel represents buccal swab and the bottom panel represents maternal plasma) and a table that shows the haplotype ratio calculation. Dotted line in the maternal plasma sample indicates the difference in peaks p1 and p2. (A) CTCE result of FDT0809 sample. Two peaks, p1 and p2 in the top panel (derived from a buccal swab), show that the subject/mother is germline heterozygous. Third peak (p3) seen between peaks p1 and p2 in the bottom panel (maternal plasma) is identified as the third haplotype, which is paternally inherited contribution to the fetus. As the experiment was performed in triplicate, HR values were reported as the mean +/− the standard deviation in the table below the panel. Peak areas (p1, p2, p3) are reported as mean value of the triplicates. The chromosome 21 call was D21 for this subject as the HR value is approximately 1. (B) CTCE result of FDT0805 sample. Two peaks, p1 and p2 in the top panel (buccal swab) show that the subject/mother is germline heterozygous. The chromosome 21 call is T21 for this subject as the HR value is approximately 2. Chromosome 21 calls by HR value were confirmed by fetal karyotype results.

