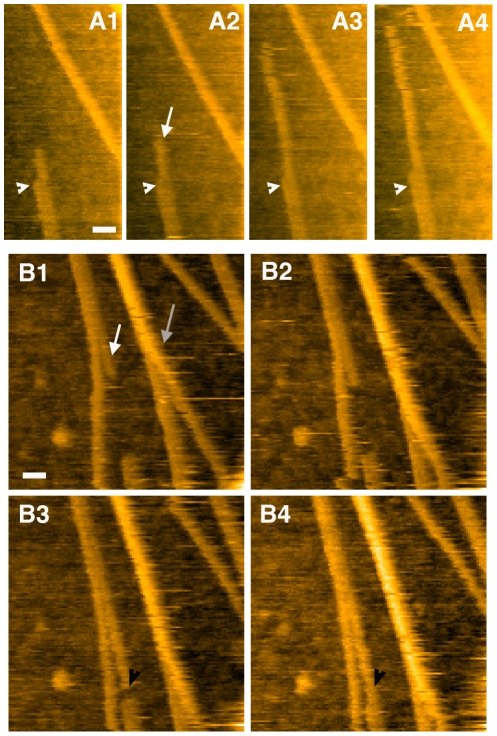
Figure 3. Time lapse of protofibril association and elongation.
Elongation of single protofibril (white arrows) is shown in time lapses A1–A4 and B1–B4. In both cases, protofibrils are laterally associated with another, at least for one part of their length. One protofibril can grow while the position of the associated fiber is constant (white arrowheads in time lapse A). Interestingly the edge of elongating protofibril can associate with that of a pre-existing protofibril forming a continuous structure (black arrowheads in B3 and B4). Real time vertical association of 2 protofibrils is also observed in time lapse B. They partially interact in B1 (grey arrow) and are mostly stacked on top of each other in B4. A globular structure is also imaged and can be used as fiducial mark. The time resolution is 2 sec, the scale bar is 30 nm, and the height scale is automatically adjusted.

