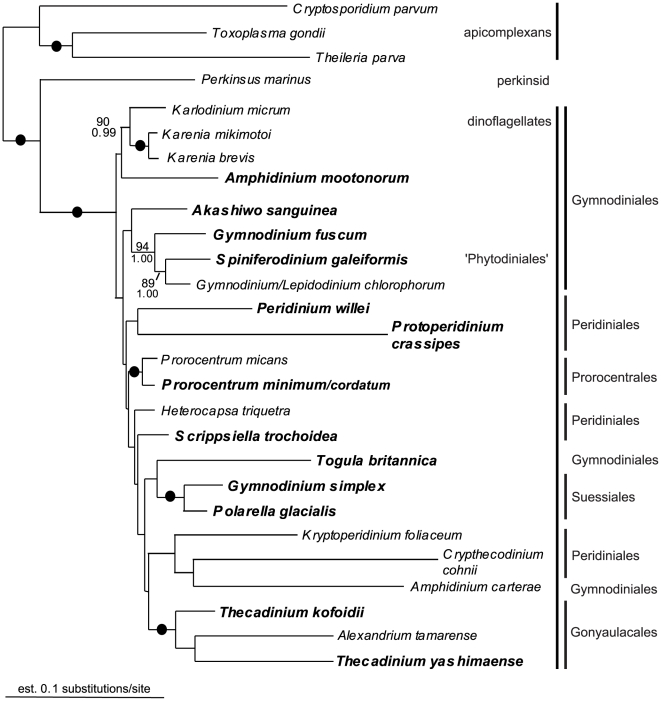
Figure 4. Bayesian tree inferred from 27 Hsp90 DNA sequences (3rd codon positions excluded) concatenated with SSU rDNA sequences and LSU rDNA sequences (dataset 6), 2847 unambiguously aligned sites and a GTR+I+G+8 model of nucleotide substitutions.
Numbers above the branches denote ML bootstrap percentages, and numbers below the branches denote Bayesian posterior probabilities. Black circles denote bootstrap percentages and posterior probabilities of 100% and 1.00, respectively.

