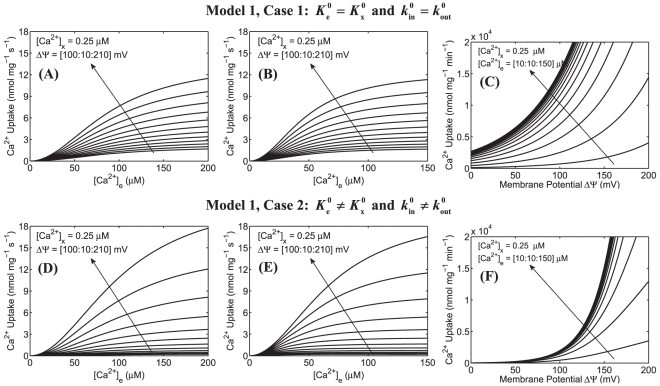
Figure 2. Predictions of mitochondrial Ca2+ uptake as a function of extra-matrix [Ca2+] for a range of ΔΨ and as a function ΔΨ for a range of extra-matrix [Ca2+] based on our previous model of mitochondrial Ca2+ uniporter.
Simulations are shown only for Model 1 under two different cases (Case 1: upper panel and Case 2: lower panel). The left panel (A and D) shows the model predicted Ca2+ uptake in response to varying extra-matrix Ca2+ corresponding to the experimental protocol of Scarpa and Graziotti [12] for a range of ΔΨ. The middle panel (B and E) shows the model predicted Ca2+ uptake in response to varying extra-matrix Ca2+ corresponding to the experimental protocol of Vinogradov and Scarpa [13] for a range of ΔΨ. In these simulations, ΔΨ was varied from 100 mV to 210 mV and matrix [Ca2+] was fixed at 0.25 µM. The right panel (C and F) shows the model predicted Ca2+ uptake as a function of ΔΨ corresponding to the experimental protocol of Wingrove et al. [16] with extra-matrix [Ca2+] ranging from 10 µM to 150 µM and matrix [Ca2+] fixed at 0.25 µM. The model uses the same parameter values as estimated earlier (Table S1). The arrows indicate the direction of increasing ΔΨ in plots A, B, D, and E and increasing extra-matrix [Ca2+] in plots C and F.

