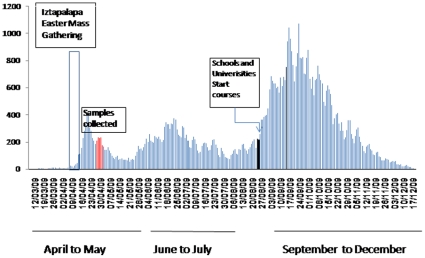
Figure 2. Epidemiological curve of confirmed cases of human infection during the outbreak of the 2009 influeza A(H1N1)v.
Three waves of influenza activity were seen: the first wave occurred between April and May, the second wave took place between June and July and the third, between September and December. Bars in red show the days when samples were collected. Iztapalapa Play passion (Bar in white) and return to schools (Blue arrow). Text in white boxes describes each event.

