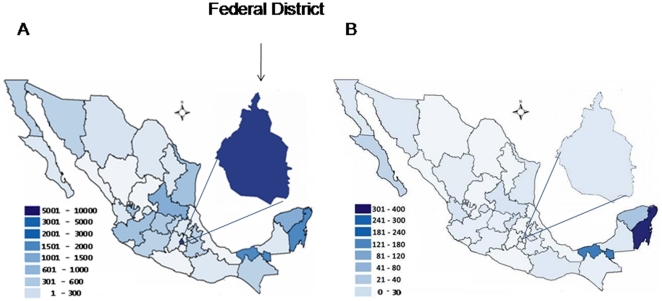
Figure 3. Distribution of human infection with 2009 influenza A(H1N1)v throughout México during the third wave.
A shows absolute numbers of confirmed cases infected with the novel virus while B gives the estimated attack rate throughout México during the third wave. Data was obtained from the Sistema Nacional de Vigilancia Epidemiológica/Dirección General Adjunta de Epidemiología/Secretaría de Salud. www.dgepi.salud.gob.mx/influenza/AH1N12009/boletines_index.html, accessed 1 March 2010 (last time).

