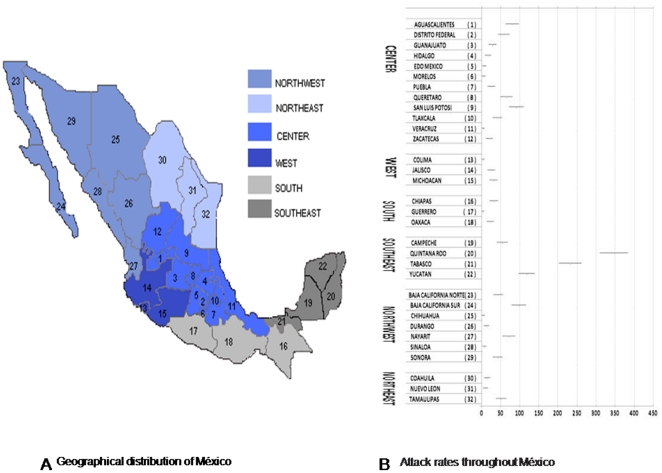
Figure 4. Estimated attack rate of influenza A (H1N1)v virus infection in the different Mexican States during the 3rd wave.
A. Map shows geographic distribution of cases throughout Mexico. B. Table shows distribution of cases quantitatively (lanes represent the mean [95% confidence interval]). Data was obtained from the Mexican Secretariat of Health: www.dgepi.salud.gob.mx/influenza/AH1N12009/boletines_index.html, accessed 1 March 2010 (last time).

