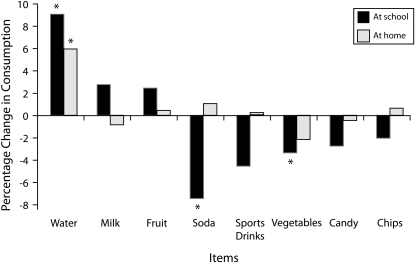
FIGURE 2.
Percentages of students reporting consumption of select items at school and at home the day prior to the survey, before and after implementation of legislation requiring school nutritional standards: Healthy Eating, Active Communities study, California, 2006–2008.
Note. Asterisks indicate a statistically significant change in reported consumption (P < .01). In 2006, the sample size was n = 3527; in 2008, it was n = 3828.

