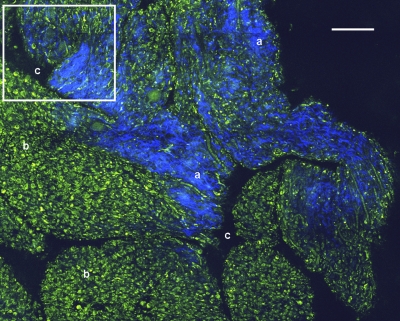
Figure 4.
A NLOM tiled image of the synovial surface layer constructed from sequentially acquired 225×225-μm images using 800-nm excitation. (a) The SHG emission from collagen is in blue, (b) TPF, in green, is mostly from intracellular sources, and (c) spaces between synovial folds lack any fluorescence signal. Scale bar is 100 μm. The box-enclosed area is further magnified in Fig. 8A to show cellular details. (Color online only.)

