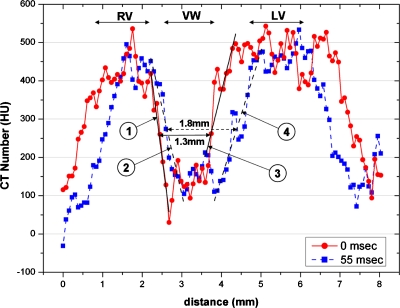
Figure 4.
Intensity profiles along the two lines within the axial images shown in Figs. 3a, 3b. For each intensity profile, the two boundary regions between the ventricles and the ventricle wall were performed with a linear fit. The fitting slopes are shown in Table 1. The three (RV, VW, and LV) sections of the line profiles are labeled in the plot. The width at the midheight of the VW section changed from 1.3 mm at 0 ms to 1.8 mm at 55 ms, representing a change of 0.5 mm in the ventricle wall thickness from diastole to systole.

