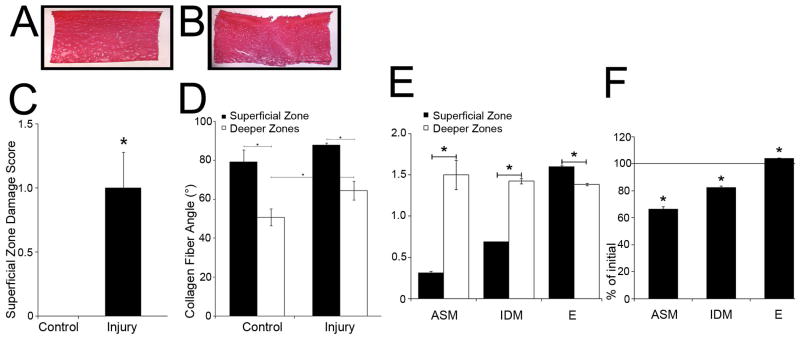
Figure 5. Histology, superficial zone damage score, collagen angles, and texture analysis of injured/control disks.
Representative samples of 6μm sections of control (A) and injured disks (B). Note the large surface ECM disruption of 207 μm width / 162 μm depth. Scale bar, 1000 μm. (C) Damage score of the superficial zone of injured/control disks after paraffin embedding/staining with Safranin O/fast green. Grade 0=normal appearing cartilage with proper staining in each zone except the intact superficial zone with the surface showing no signs of damage; Grade 1=minimal surface damage with isolated disruptions; Grade 2=moderate surface damage with widespread disruption; Grade 3=minimal permanent compression; Grade 4=permanent compression to approximately ≥ 30% of the original disk thickness. (D) Angle (°) between collagen fibers and longitudinal disk axis of injured and control disks. (E) Texture analysis of zonal differences of control disks. ASM=Angular Second Moment, IDM=Inverse Difference Moment, E=Entropy. (F) The percent change in texture analysis measures after injury.
(C) Each group of superficial zone and deeper zones disks: n ≥ 17 samples. (D) Control group: n ≥ 7 samples, Injury group: n ≥ 10 samples. (E, F) Each group: n ≥ 6 samples.

