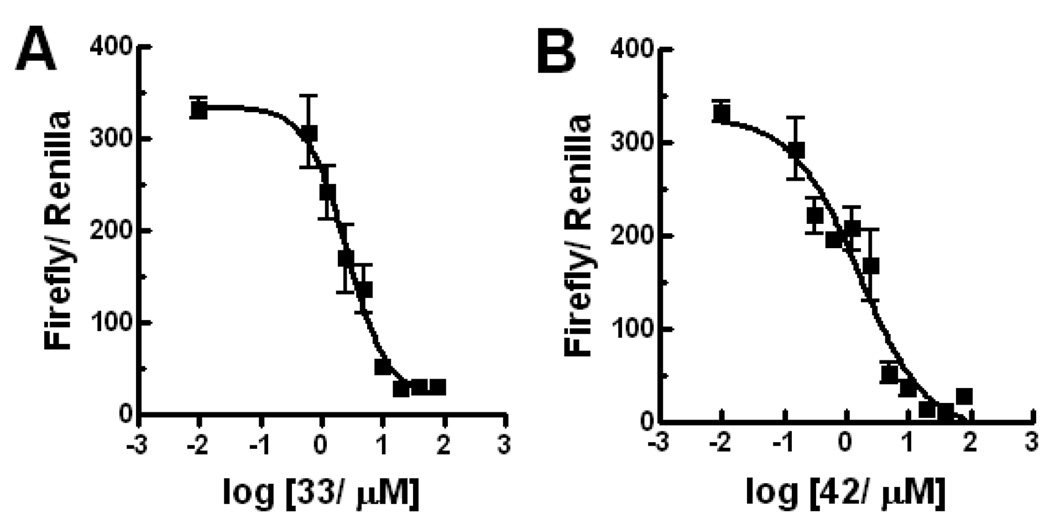
Figure 5.
Dose response of Gli-Luc signal in Gli1-transfected C3H10T1/2 cells treated with 33 (panel A) or 42 (panel B). Data was plotted and curve fitted by Prism 4.03 (GraphPad Software). IC50 was estimated as 2.6 µM (1.77 to 3.75 µM for 95% confidence intervals) for 33 with curve fitting: R2= 0.93, and 1.6 µM (0.82 to 3.05 µM for 95% confidence intervals) for 42 with curve fitting: R2= 0.90. Error bars represent standard error of triplicate data.

