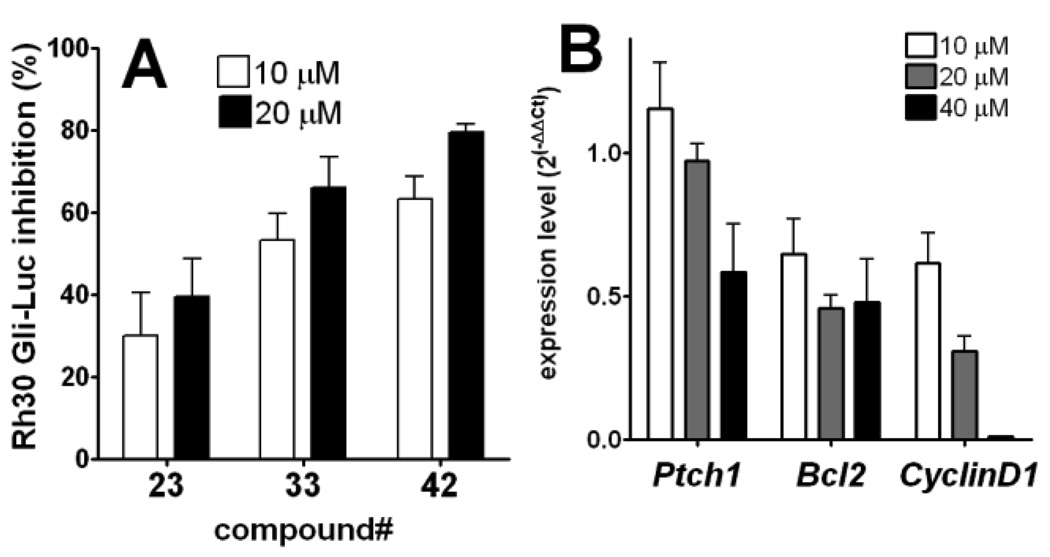
Figure 7.
Panel A: lead compounds inhibit transcription by endogenous Gli in Rh30 cells. Percent inhibition of Gli-reporter activity in Rh30 cells (without Gli1 transfection) 24 h after addition of 10 µM (open bar) or 20 µM (closed bar) of the test compound. Each firefly luciferase signal is normalized with Renilla luciferase transfection control, and then normalized by firefly luciferase activity with DMSO treatment serving as 0% inhibition. Error bars represent standard error of triplicate data. Panel B: compound 33 inhibits expression of Gli1-target genes18 in Rh30 cells. Expression levels of each indicated Gli1-mediated transcription products in Rh30 cells were measured by real-time RT-PCR 24 h after addition of 33. Error bars represent standard error of duplicate data. Average ΔCt (Ct(target gene)-Ct(GAPDH)) were subtracted with that of DMSO treatment to calculate ΔΔCt. Ct, cycle time.

