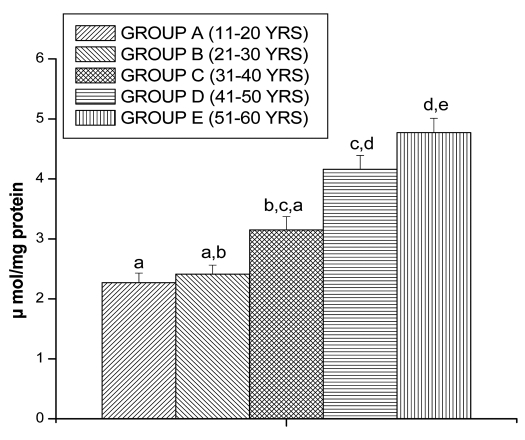
Figure 2.
PC levels in lymphocyte of different age group of human subjects were estimated using UV-Vis Spectrophotometer. Data are expressed as mean ± SEM, n = 20. The difference between Group A–E were analyzed with Student's t-test. Values not sharing a common superscript letter (a–e) are stastically significant at the level of p < 0.05.

