
Figure 6.
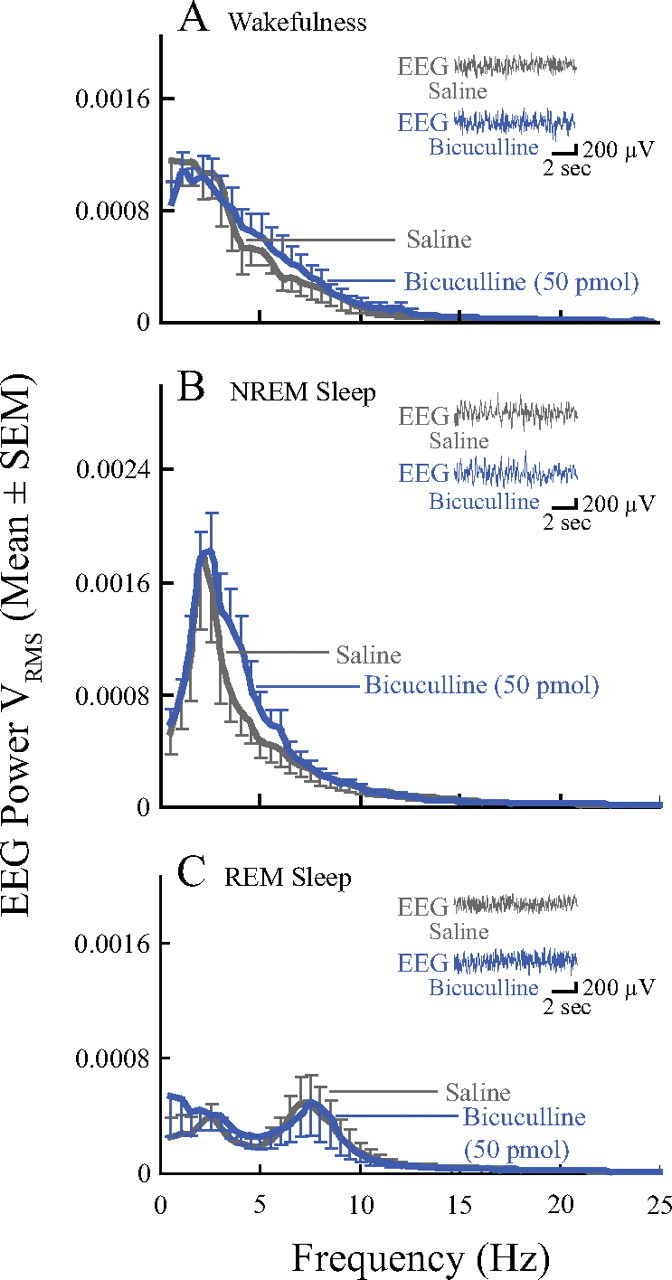
EEG power was not altered by microinjection of bicuculline into the PnO. Graphs plot average (n = 6 mice) EEG power during wakefulness (A), NREM sleep (B), and REM sleep (C) after microinjection of saline (gray line) and bicuculline (blue line). The EEG power functions are based on 50 min of recording during wakefulness (A), 60 min of recording during NREM sleep (B), and 50 min of recording during REM sleep (C). The insets show representative pairs of 10 s EEG recordings from the same mouse and illustrate the similarity of the raw signals after microinjection of bicuculline and saline.