
FIG. 4.
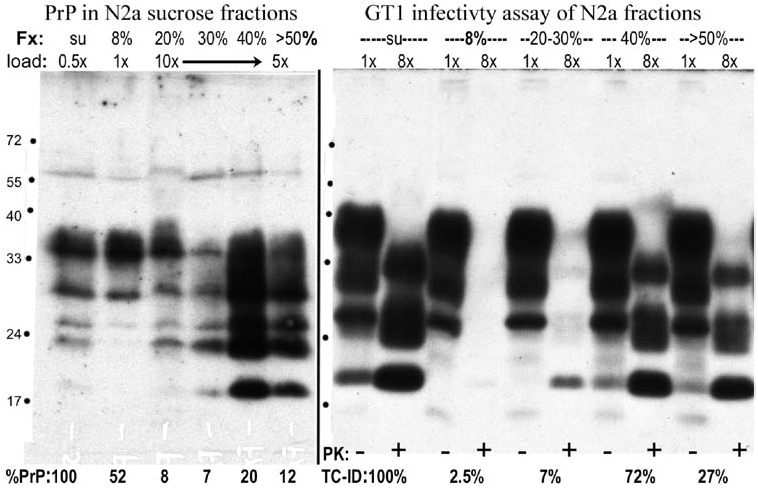
Infectivity assays of fractions from the other 1.5-h gradients showed that the vast majority of infectious particles again migrated to the bottom of the tube, whereas the majority of PrP remained in the top, as shown here for pooled fractions of a gradient loaded with unsonicated supernatant. The left panel shows the %PrP in each fraction, and the right panel shows aliquots of the same samples with equivalent cell equivalents applied to GT1 indicator cells for the infectivity assay; the average of four assay points (TC-ID) are shown beneath each GT1 lane. This blot is a representative sample from GT1 cells assayed at passage 3. The bottom fractions (>30% sucrose) contain virtually all the applied infectivity, whereas the top 8% sucrose fraction with high PrP contained <3% of the TC-ID; 108% of the loaded infectivity was recovered in these gradient fractions.