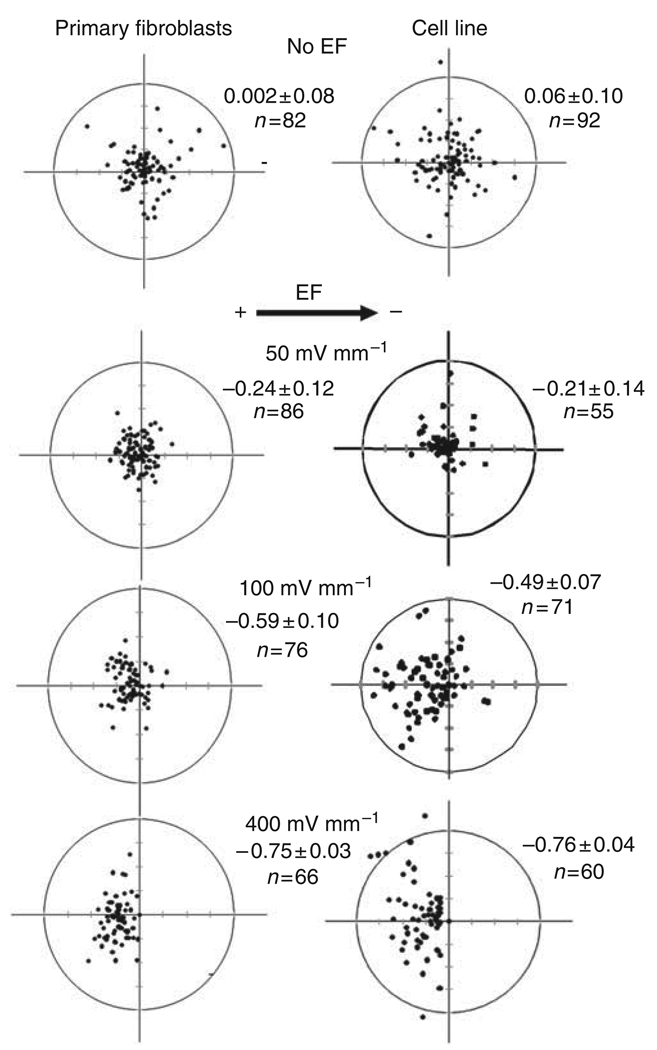
Figure 3. Scatter plots show cell migration for 5 hours in the presence or absence of an electric field (EF).
The start position of each cell was set as the origin in the center of the scatter plots (0,0). Black dots represent positions of individual cells after 5 hours. Primary culture and cell line fibroblasts migrated directionally toward the anode (left) in an EF of 100 and 400 mV mm−1. The radius of each circle represents 150 µm of translocation distance. “n” represents the total number of cells in each condition. The directedness of migration is shown on the upper right corner of each plot (mean±SEM). The cathode is to the right of each graph. The data shown are from at least four independent experiments.

