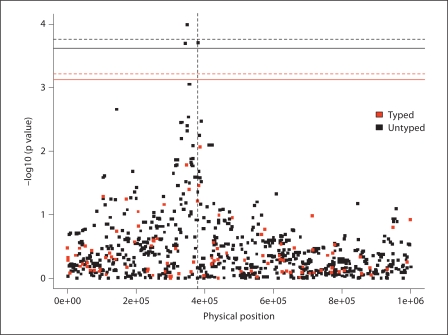
Fig. 1.
Example showing analysis of a simulated dataset. Black dots represent efficient score-based testing (using sharing method to estimate mi) of untyped loci. Red dots represent tests of observed genotypes. Black and red solid horizontal lines represent significance thresholds used in simulation study for untyped- and typed-only analyses, respectively. Black and red dashed horizontal lines represent significance thresholds for untyped- and typed-only analyses, respectively, established by permutation applied to this dataset. Dashed vertical line denotes location of true disease locus.

