
Figure 6.
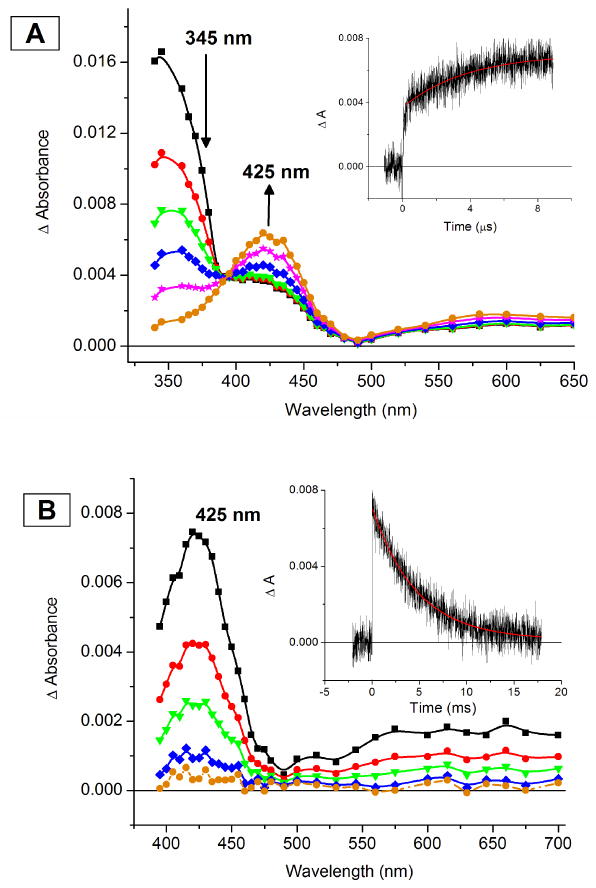
Absorption difference spectra [NMe2LCuI/II-X − NMe2LCuI-CO] recorded after pulsed λex =355 nm excitation of NMe2LCuI-CO in THF at 193 K under 1 atm O2:CO (1:1) mixture. The spectra were recorded at various delay times: (A) 0 to 5 μs representing the conversion of NMe2LCuI to a mixture of NMe2LCuI-CO and NMe2LCuII-O2−: black squares, 0 μs; red circles, 0.1 μs; green triangles, 0.25 μs; blue diamonds, 1 μs; magenta stars, 2.5 μs; orange circles, 5.0 μs. The inset is an absorption transient monitored at 425 nm with a superimposed first-order fit (in red), kobs = 2.92 × 10⁵ s-1 and (B) 0 ms to 20 ms representing the conversion from NMe2LCuII-O2− to NMe2LCuI-CO: black squares, 0 ms; red circles, 2.5 ms; green triangles, 5.0 ms; blue diamonds, 10 ms; orange circles, 20 ms. The inset is an absorption transient monitored at 425 nm with a superimposed first-order fit (in red), kobs = 236 s-1.