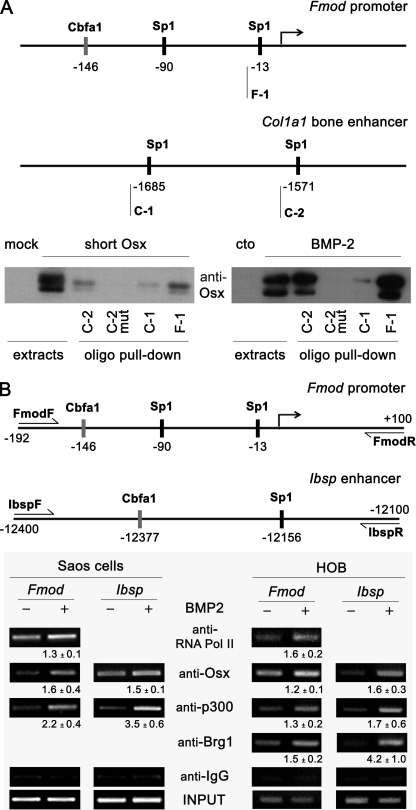
FIGURE 4.
Osx interaction with Sp1 regions in regulatory sites of Fmod and Ibsp genes. A, upper panel, Sp1 regions analyzed by oligo pulldown. Biotinylated (biot) oligonucleotide sequences used were as follows: F-1, 5′-taggaatttggggcgggaccctggt-biot; C-1, 5′-ggaacagaaggggagggagc-biot; C-2, 5′-cagggagtcccgcctcctccaaac-biot; and C-2 mut, 5′-cagggagtattgtttcctccaaac-biot. Lower panel, the indicated double-stranded biotinylated oligonucleotides were incubated with equal aliquots of extracts from C2C12 cells either transfected with an Osx construct using mock as control or treated without (cto) or with BMP-2 in medium without serum for 24 h. Precipitated complexes were analyzed by immunoblotting using Osx antibody. B, upper panel, promoter regions analyzed by chromatin immunoprecipitation. Lower panels, Saos-2 cells or human primary osteoblasts (HOB) were treated with BMP-2 for 24 h in medium without serum. Cells were fixed with formaldehyde, and chromatin immunoprecipitation analysis was performed by incubating DNA-protein complexes using the indicated antibodies and IgG as a control. Quantification of the results of two independent experiments is shown below each panel as mean ± S.E. Pol, polymerase.

