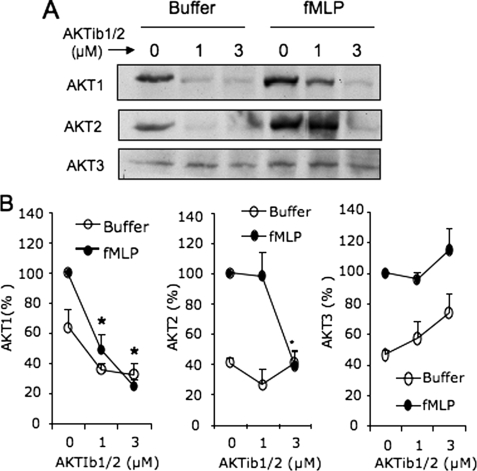
FIGURE 8.
Membrane translocation of AKT isoforms induced by fMLP in control and AKTIb1/2-treated dHL-60 cells. Cells were pretreated for 15 min with 1 and 3 μm AKTib1/2 and stimulated with 1 μm fMLP (2 min). A, cells were disrupted by sonication, and the membrane fractions were prepared and Western-blotted. B, the amount of AKT1, AKT2, and AKT3 was quantified and expressed as a percentage of the maximal control values obtained with fMLP (mean ± S.E., n = 3 experiments; *, p < 0.05).

