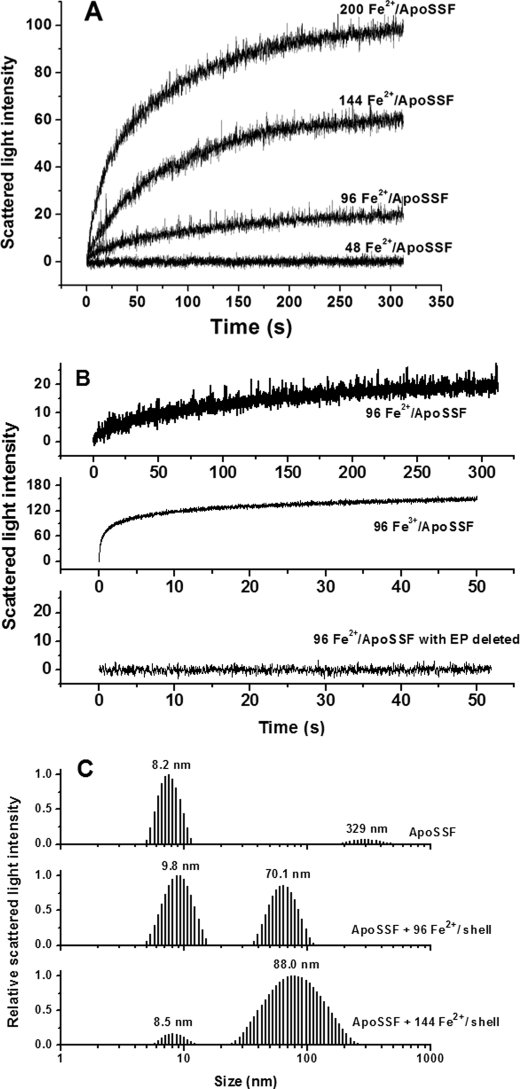
FIGURE 4.
A, time course of WT SSF aggregation during Fe2+ oxidation. B, time course of WT SSF or EP-deleted SSF aggregation upon the addition of Fe2+ or Fe3+. The curve represents an average of six experimental measurements. C, relative scattered light intensity distribution curves for apoSSF and apoSSF plus Fe2+ ion. Conditions were as follows: [WT SSF] = 0.5 μm in 100 mm Mops (pH 7.0), 24–100 μm FeSO4, 25 °C.

