FIGURE 5.
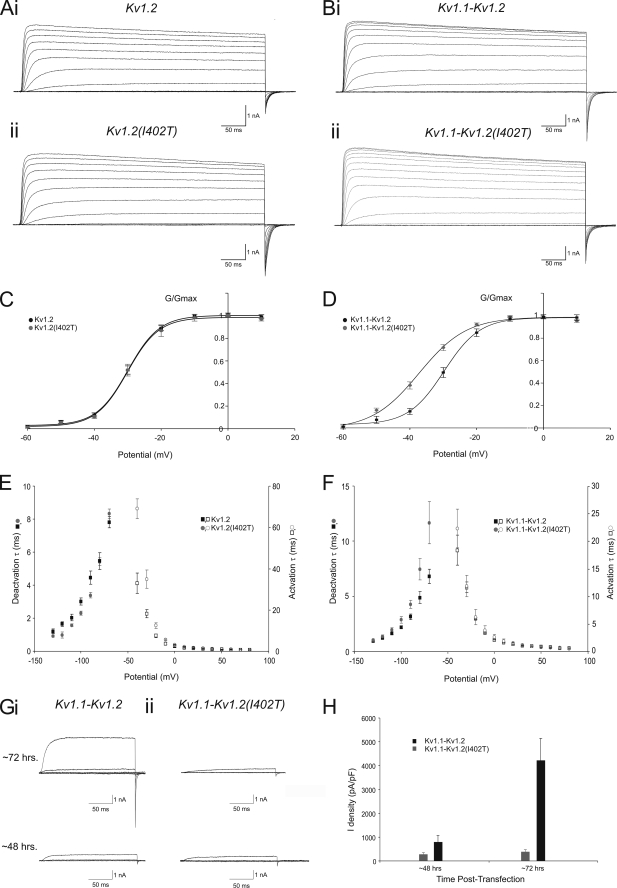
The Kv1.2 I402T missense mutation results in gating, kinetic, and surface expression level changes in homomeric and heteromeric channels that contain the Kv1. 2(I402T) α-subunit in CHO cells. A, shown are representative currents, recorded from a CHO cell expressing either Kv1.2 (Ai) or Kv1.2(I402T) (Aii) 48 h post-transfection using +10-mV incrementing steps to +60 mV from a holding potential of −90 mV. Scale bar, 1 nA, 50 ms. B, representative currents, recorded from a CHO cell expressing either Kv1.1 (Bi) and Kv1.2 or Kv1.1 and Kv1.2(I402T) (Bii) 48 h post-transfection using +10-mV incrementing steps to +60 mV from a holding potential of −90 mV. Scale bar, 1 nA, 50 ms. C, shown are the mean g/gmax-voltage relationship for whole cell, voltage-clamped CHO cells expressing Kv1.2 (n = 10, black squares) or Kv1.2(I402T) (n = 10, grey circles). The Boltzmann functions shown superimposed on the data points gave the V½ and slope values quoted under “Results.” D, shown are the mean g/gmax-voltage relationship for whole cell, voltage-clamped CHO cells expressing Kv1.1 and Kv1.2 (n = 10, black squares) α-subunits or Kv1.1 and Kv1.2(I402T) (n = 10, grey circles). The Boltzmann functions shown superimposed on the data points gave the V½ and slope values quoted under “Results.” E, shown are the mean activation and deactivation time constants from whole cell, voltage-clamped CHO cells expressing Kv1.2 (n = 8, black squares) or Kv1.2(I402T) (n = 8, grey circles). F, shown are the mean activation and deactivation time constants from whole cell, voltage-clamped CHO cells expressing Kv1.1 and Kv1.2 (n = 8, black squares) or Kv1.1 and Kv1.2(I402T) (n = 8, grey circles). G, shown are representative currents, recorded from CHO cells expressing either Kv1.1 and Kv1.2 (Gi) or Kv1.1 and Kv1.2(I402T) (Gii) ∼48 and ∼72 h post-transfection using +10-mV incrementing steps to −30 mV from a holding potential of −90 mV. Scale bar, 1 nA, 50 ms. H, shown are mean maximum current density from whole cell, voltage-clamped CHO cells expressing Kv1.1 and Kv1.2 (n = 8, black bars) or Kv1.1 and Kv1.2(I402T) (n = 8, grey bars) after ∼48 and ∼72 h post-transfection.

