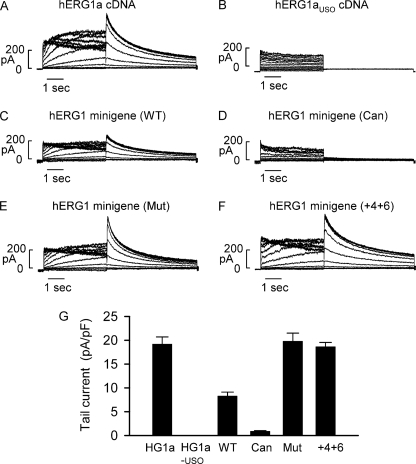
FIGURE 6.
Voltage clamp recordings of hERG1 currents from minigenes and cDNAs expressed in HEK293 cells. A and B, representative currents recorded from cells transfected with hERG1a or hERG1aUSO cDNA. C–F, representative currents recorded from cells transfected with the minigenes carrying the wild-type (WT), canonical (Can), and mutant (Mut) intron 9 poly(A) signals, and 5′ splice site mutation +4U>A/+6G>U (+4+6). G, histogram showing the averaged tail current density measured at −50 mV following a 4-s depolarizing pulse to 20 mV for hERG1a cDNA (n = 8), hERG1aUSO cDNA (n = 9), wild-type minigene (n = 13), minigene with canonical intron 9 poly(A) signal (n = 11), minigene with mutant intron 9 poly(A) signal (n = 12), and minigene with 5′ splice site mutation +4U>A/+6G>U (n = 8).

