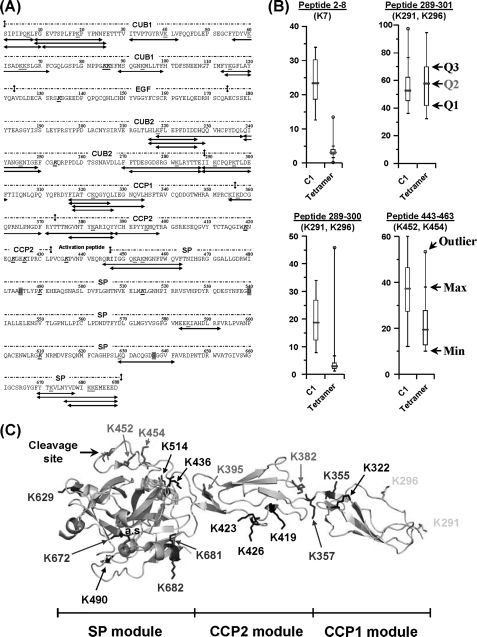
FIGURE 3.
Modification of the C1r solvent accessibility upon association of the C1s-C1r-C1r-C1s tetramer with C1q. A, amino acid sequence of C1r showing the 36 lysine-containing peptic fragments (in red, bold type, and underlined) selected for quantitative analysis. Lysines that could not be recovered are shown in black, bold type, and underlined. The catalytic residues His485, Asp540, and Ser637 and the Arg-Ile cleavage site are highlighted in magenta and shown in blue, respectively. C1r residues interacting with C1q (17) are highlighted in yellow. B, effect of C1q binding on the solvent accessibility of residues Lys7 (CUB1), Lys291/Lys296 (CCP1), and Lys452/Lys454 (SP domain). Each box-and-whisker plot compares the statistical distribution of the unmodified fraction of a given C1r peptide in the presence (C1) or absence (tetramer) of C1q. Q1, Q2, and Q3 correspond to the lower, median (red bar), and third quartiles, respectively. The largest (Max) and smallest (Min) non-outlier observations are marked with a small black vertical line (whiskers). Data points lying above the upper whisker or below the lower whisker are considered as outliers and indicated by an open circle. C, structure of the zymogen CCP1-CCP2-SP C1r catalytic domain (10) showing the position of lysine residues. The catalytic triad (His485, Asp540, and Ser637) is represented by three magenta spheres. Lysine residues are color-coded as follows: blue, no modification of surface accessibility upon C1 assembly; red, decreased surface accessibility; yellow, decreased and/or unmodified surface accessibility; and black, no data available.

