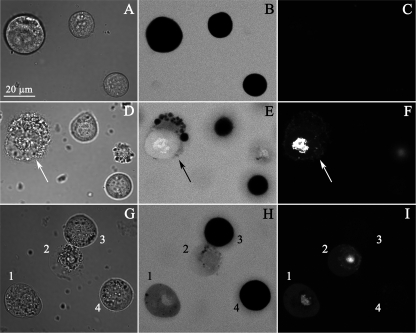
FIGURE 6.
Sf9 cells membrane lysis by CpTx 1. Upper row, A–C, before the toxin application, middle and bottom rows (D–F and G–I), 30 min after 10 μm CpTx 1 was added. Left column, A, D, and G, transmitted light images; middle column, B, E, and H, CF fluorescence confocal images; right column, C, F, and I, PI fluorescence. D, E, and F, the damaged cell is indicated by an arrow. G–I, the cells marked as 1 and 2 have lesions in the membrane, and the cells marked 3 and 4 remain impermeable for CF and PI.

